SynGraphy: Succinct Summarisation of Large Networks via Small Synthetic Representative Graphs
Publication
Metrics
AI Quick Summary
SynGraphy presents a novel method for summarising large network datasets by creating small synthetic representative graphs that mirror the structural properties of the original networks. Experimental results show that SynGraphy is more effective than traditional visualisation techniques in conveying meaningful information about complex networks.
Paper Preview
Abstract
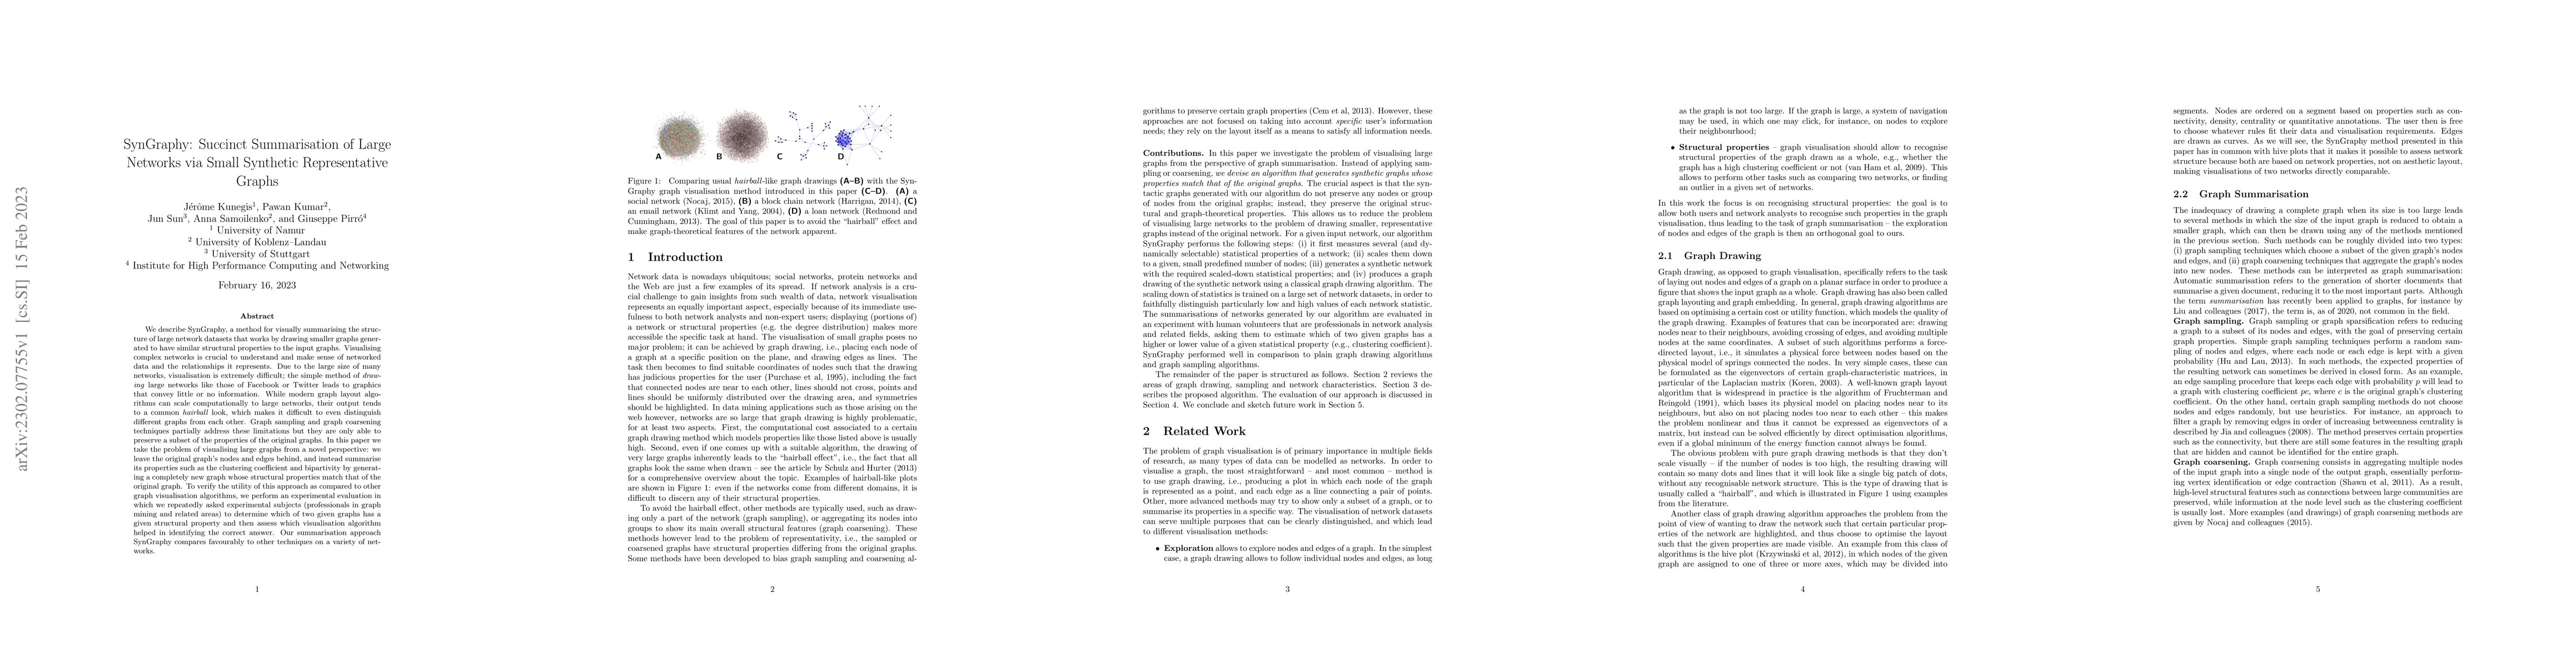
We describe SynGraphy, a method for visually summarising the structure of large network datasets that works by drawing smaller graphs generated to have similar structural properties to the input graphs. Visualising complex networks is crucial to understand and make sense of networked data and the relationships it represents. Due to the large size of many networks, visualisation is extremely difficult; the simple method of drawing large networks like those of Facebook or Twitter leads to graphics that convey little or no information. While modern graph layout algorithms can scale computationally to large networks, their output tends to a common "hairball" look, which makes it difficult to even distinguish different graphs from each other. Graph sampling and graph coarsening techniques partially address these limitations but they are only able to preserve a subset of the properties of the original graphs. In this paper we take the problem of visualising large graphs from a novel perspective: we leave the original graph's nodes and edges behind, and instead summarise its properties such as the clustering coefficient and bipartivity by generating a completely new graph whose structural properties match that of the original graph. To verify the utility of this approach as compared to other graph visualisation algorithms, we perform an experimental evaluation in which we repeatedly asked experimental subjects (professionals in graph mining and related areas) to determine which of two given graphs has a given structural property and then assess which visualisation algorithm helped in identifying the correct answer. Our summarisation approach SynGraphy compares favourably to other techniques on a variety of networks.
AI Key Findings
Get AI-generated insights about this paper's methodology, results, significance, and more — seven facets brought into focus.
Impact
Paper Details
Authors
PDF Preview
Key Terms
Citation Network
Current paper (gray), citations (green), references (blue)
Display is limited for performance on very large graphs.
Discussion 0