Publication
Metrics
Paper Preview
Abstract
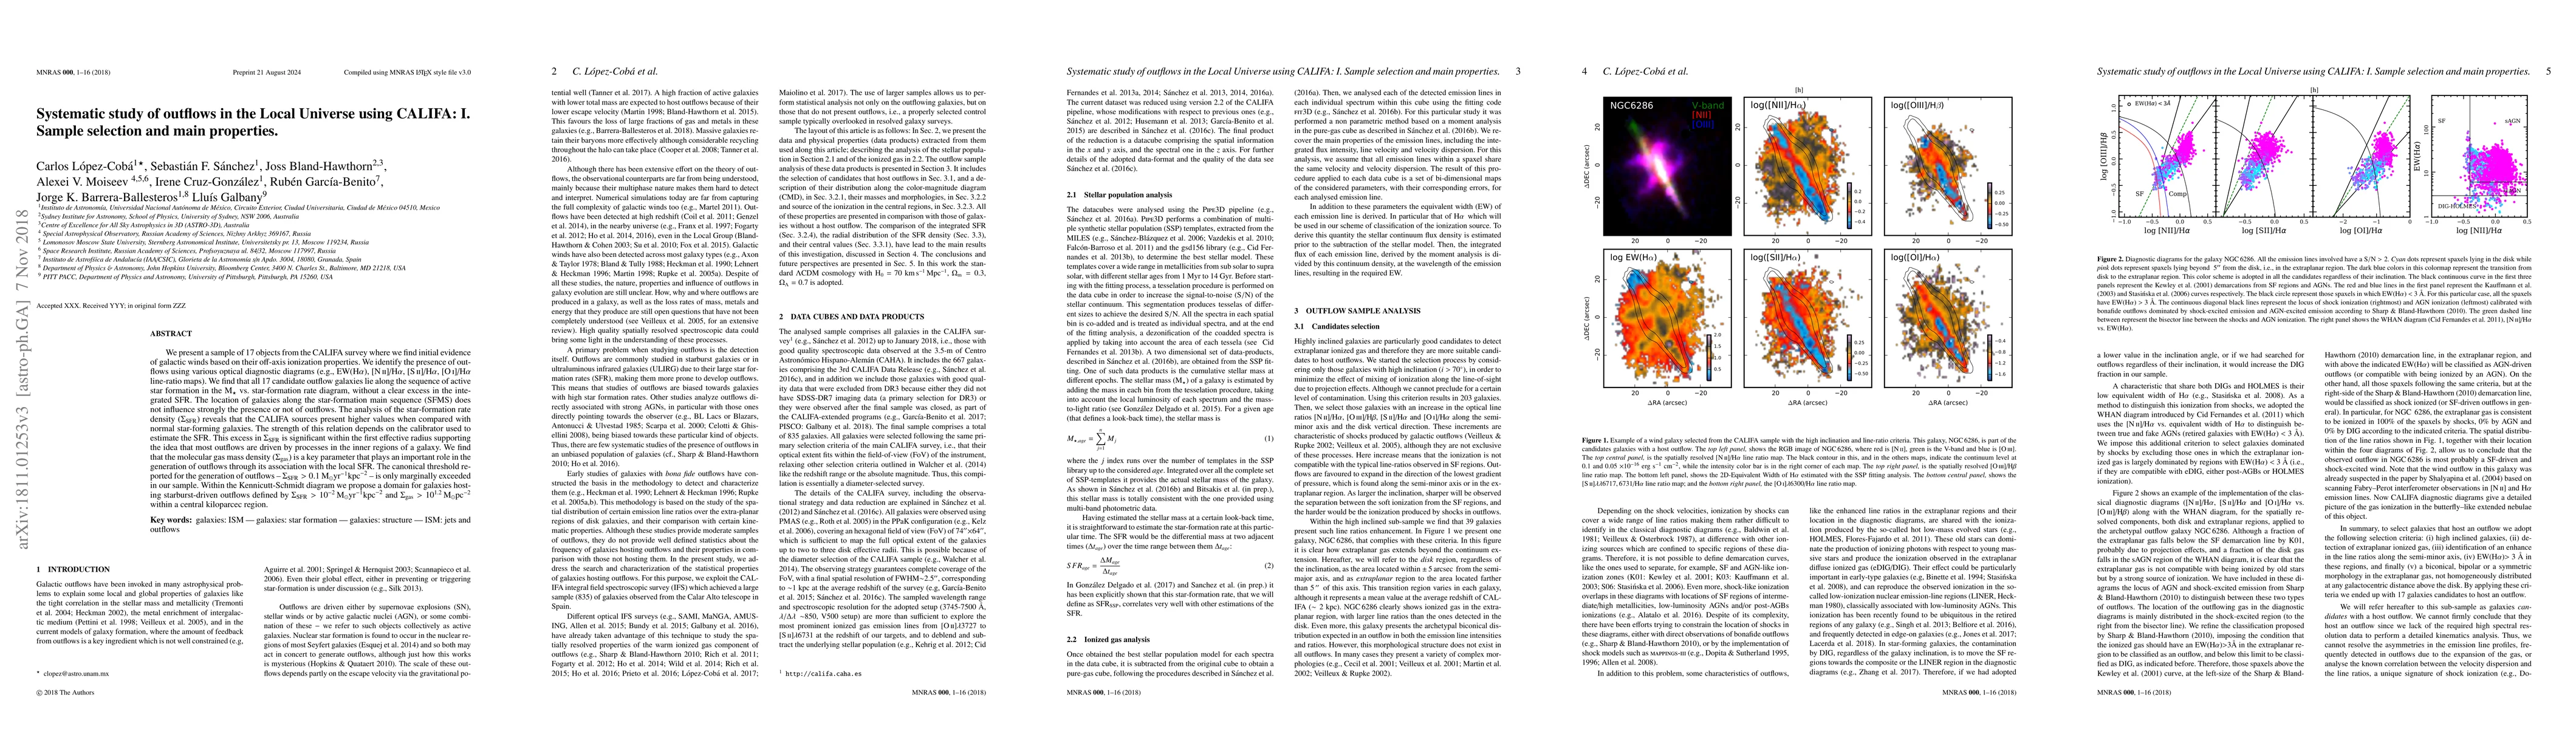
We present a sample of 17 objects from the CALIFA survey where we find initial evidence of galactic winds based on their off-axis ionization properties. We identify the presence of outflows using various optical diagnostic diagrams (e.g., EW(H$\alpha$), [Nii]/H$\alpha$, [Sii]/H$\alpha$, [Oi]/H$\alpha$ line-ratio maps). We find that all 17 candidate outflow galaxies lie along the sequence of active star formation in the M$_\star$ vs. star-formation rate diagram, without a clear excess in the integrated SFR. The location of galaxies along the star-formation main sequence (SFMS) does not influence strongly the presence or not of outflows. The analysis of the star-formation rate density ($\Sigma_{\rm SFR}$) reveals that the CALIFA sources present higher values when compared with normal star-forming galaxies. The strength of this relation depends on the calibrator used to estimate the SFR. This excess in $\Sigma_{\rm SFR}$ is significant within the first effective radius supporting the idea that most outflows are driven by processes in the inner regions of a galaxy. We find that the molecular gas mass density ($\Sigma_\mathrm{gas}$) is a key parameter that plays an important role in the generation of outflows through its association with the local SFR. The canonical threshold reported for the generation of outflows -- $\Sigma_{\rm SFR}>0.1$ $\mathrm{M}_\odot \mathrm{yr}^{-1} \mathrm{kpc}^{-2}$ -- is only marginally exceeded in our sample. Within the Kennicutt-Schmidt diagram we propose a domain for galaxies hosting starburst-driven outflows defined by $\Sigma_{\rm SFR}>10^{-2} \,\mathrm{M}_\odot \mathrm{yr}^{-1} \mathrm{kpc}^{-2}$ and $\Sigma_\mathrm{gas}>10^{1.2} \, \mathrm{M}_\odot \mathrm{pc}^{-2}$ within a central kiloparcec region.
AI Key Findings
Get AI-generated insights about this paper's methodology, results, significance, and more — seven facets brought into focus.
Impact
Paper Details
PDF Preview
Key Terms
Citation Network
Current paper (gray), citations (green), references (blue)
Display is limited for performance on very large graphs.
Discussion 0