TA-Dash: An Interactive Dashboard for Spatial-Temporal Traffic Analytics -- Demo Paper
Publication
Metrics
AI Quick Summary
This paper introduces TA-Dash, an interactive dashboard for visualizing complex spatial-temporal urban traffic patterns, aiming to improve the utility of machine learning models in traffic analytics.
Paper Preview
Abstract
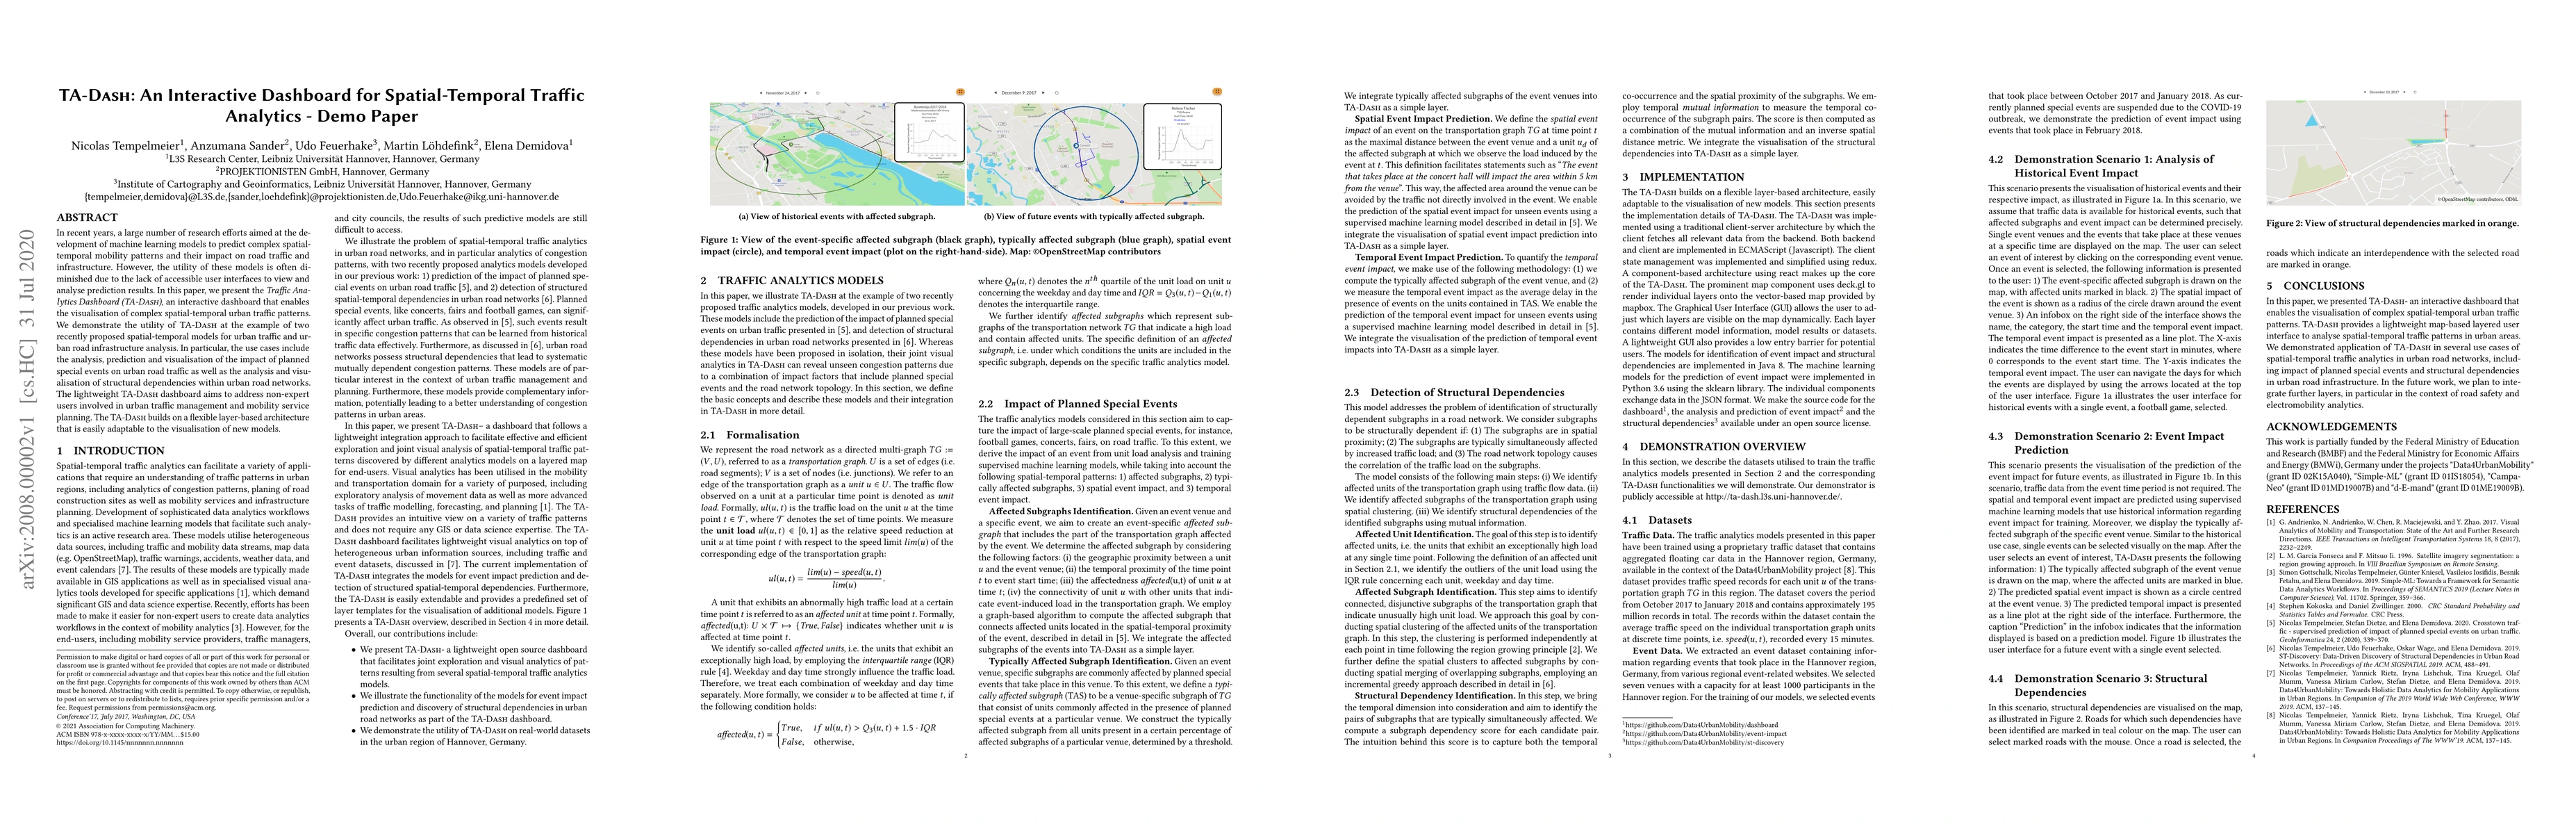
In recent years, a large number of research efforts aimed at the development of machine learning models to predict complex spatial-temporal mobility patterns and their impact on road traffic and infrastructure. However, the utility of these models is often diminished due to the lack of accessible user interfaces to view and analyse prediction results. In this paper, we present the Traffic Analytics Dashboard ( TA-Dash), an interactive dashboard that enables the visualisation of complex spatial-temporal urban traffic patterns. We demonstrate the utility of TA-Dash at the example of two recently proposed spatial-temporal models for urban traffic and urban road infrastructure analysis. In particular, the use cases include the analysis, prediction and visualisation of the impact of planned special events on urban road traffic as well as the analysis and visualisation of structural dependencies within urban road networks. The lightweight TA-Dash dashboard aims to address non-expert users involved in urban traffic management and mobility service planning. The TA-Dash builds on a flexible layer-based architecture that is easily adaptable to the visualisation of new models.
AI Key Findings
Get AI-generated insights about this paper's methodology, results, significance, and more — seven facets brought into focus.
Impact
Paper Details
Authors
PDF Preview
Key Terms
Citation Network
Current paper (gray), citations (green), references (blue)
Display is limited for performance on very large graphs.
Discussion 0