Table2Image: Interpretable Tabular data Classification with Realistic Image Transformations
Publication
Metrics
AI Quick Summary
This paper presents Table2Image, a framework transforming tabular data into realistic images for interpretable classification. It introduces VIF initialization and integrates SHAP explanations to enhance model performance and interpretability, achieving competitive results on benchmark datasets.
Paper Preview
Abstract
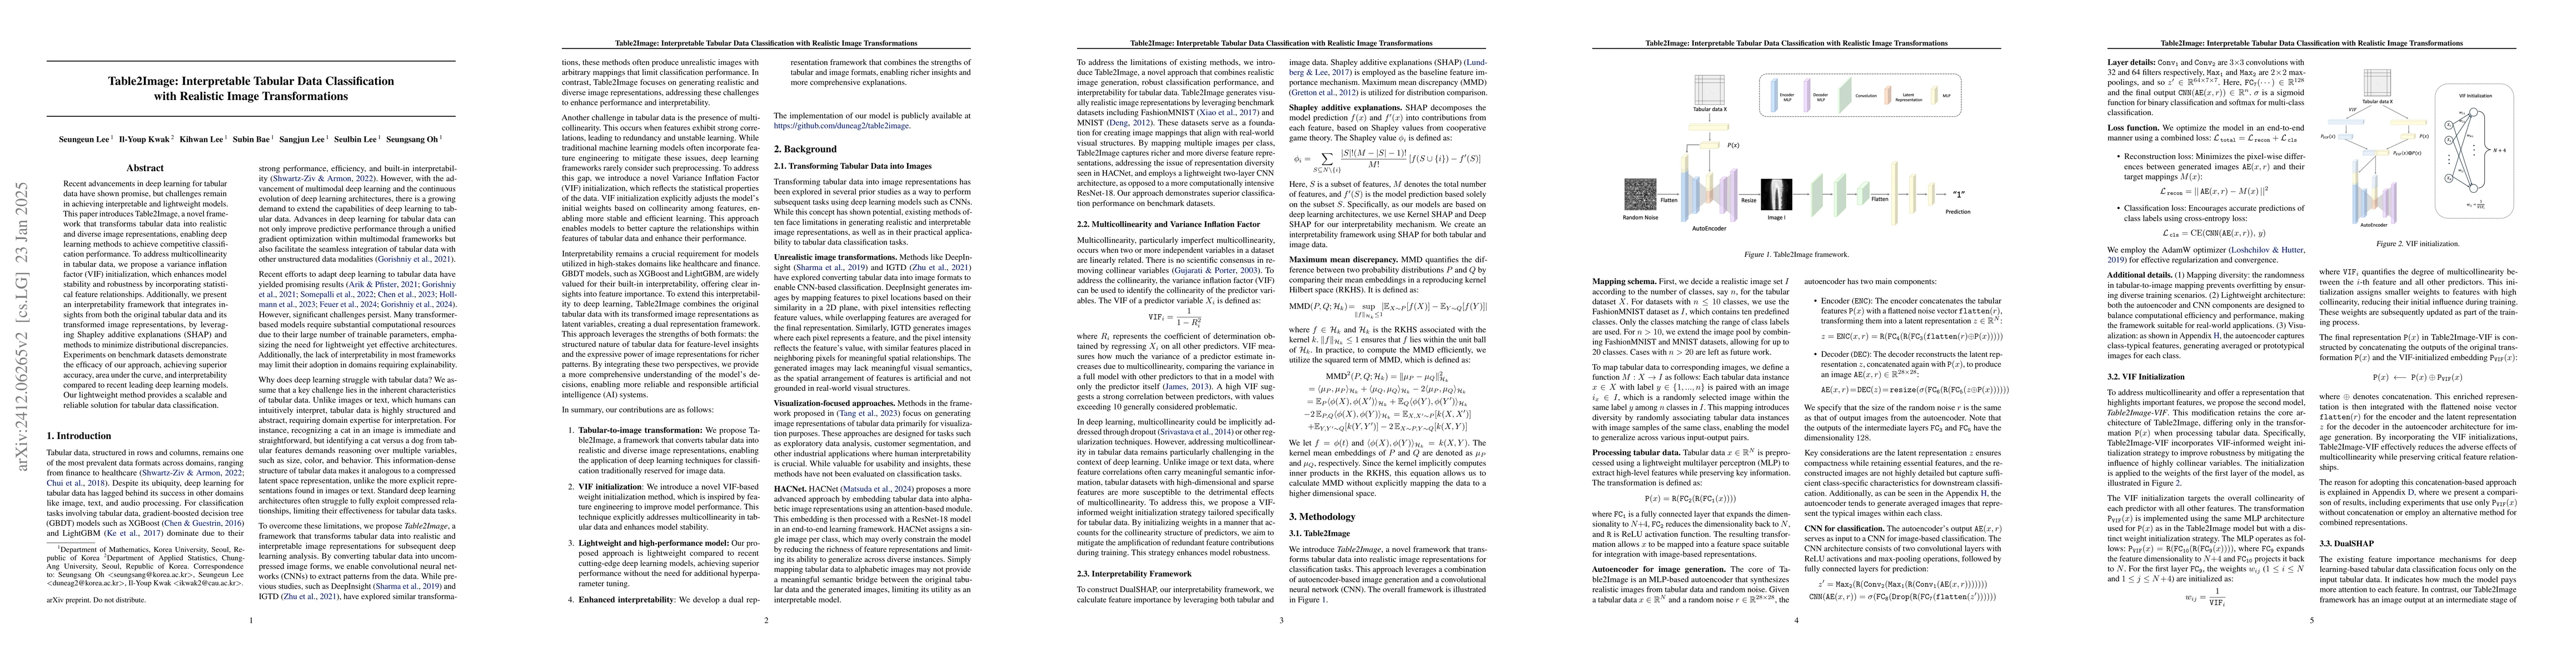
Recent advancements in deep learning for tabular data have demonstrated promising performance, yet interpretable models remain limited, with many relying on complex and large-scale architectures. This paper introduces Table2Image, an interpretable framework that transforms tabular data into realistic image representations for classification, achieving competitive performance with relatively lightweight models. Additionally, we propose variance inflation factor (VIF) initialization, which reflects the statistical properties of the data, and a novel interpretability framework that integrates insights from both the original tabular data and its image transformations. By leveraging Shapley additive explanations (SHAP) with methods to minimize distributional discrepancies, our approach combines tabular and image-based representations. Experiments on benchmark datasets showcase competitive classification accuracy, area under the curve (AUC), and improved interpretability, offering a scalable and reliable solution. Our code is available at https://github.com/duneag2/table2image.
AI Key Findings
Get AI-generated insights about this paper's methodology, results, significance, and more — seven facets brought into focus.
Authors
PDF Preview
Related Papers
No references found for this paper.
Discussion 0