Tag Clouds for Software Documents Visualization
Publication
Metrics
AI Quick Summary
This paper proposes a new method to visualize software documents using a tag cloud, where tags are displayed based on their frequency and importance, with larger fonts for more significant tags. The method, called JavaDocCloud, was validated on NanoXML, showing common and uncommon tags in JavaDoc documentation.
Paper Preview
Abstract
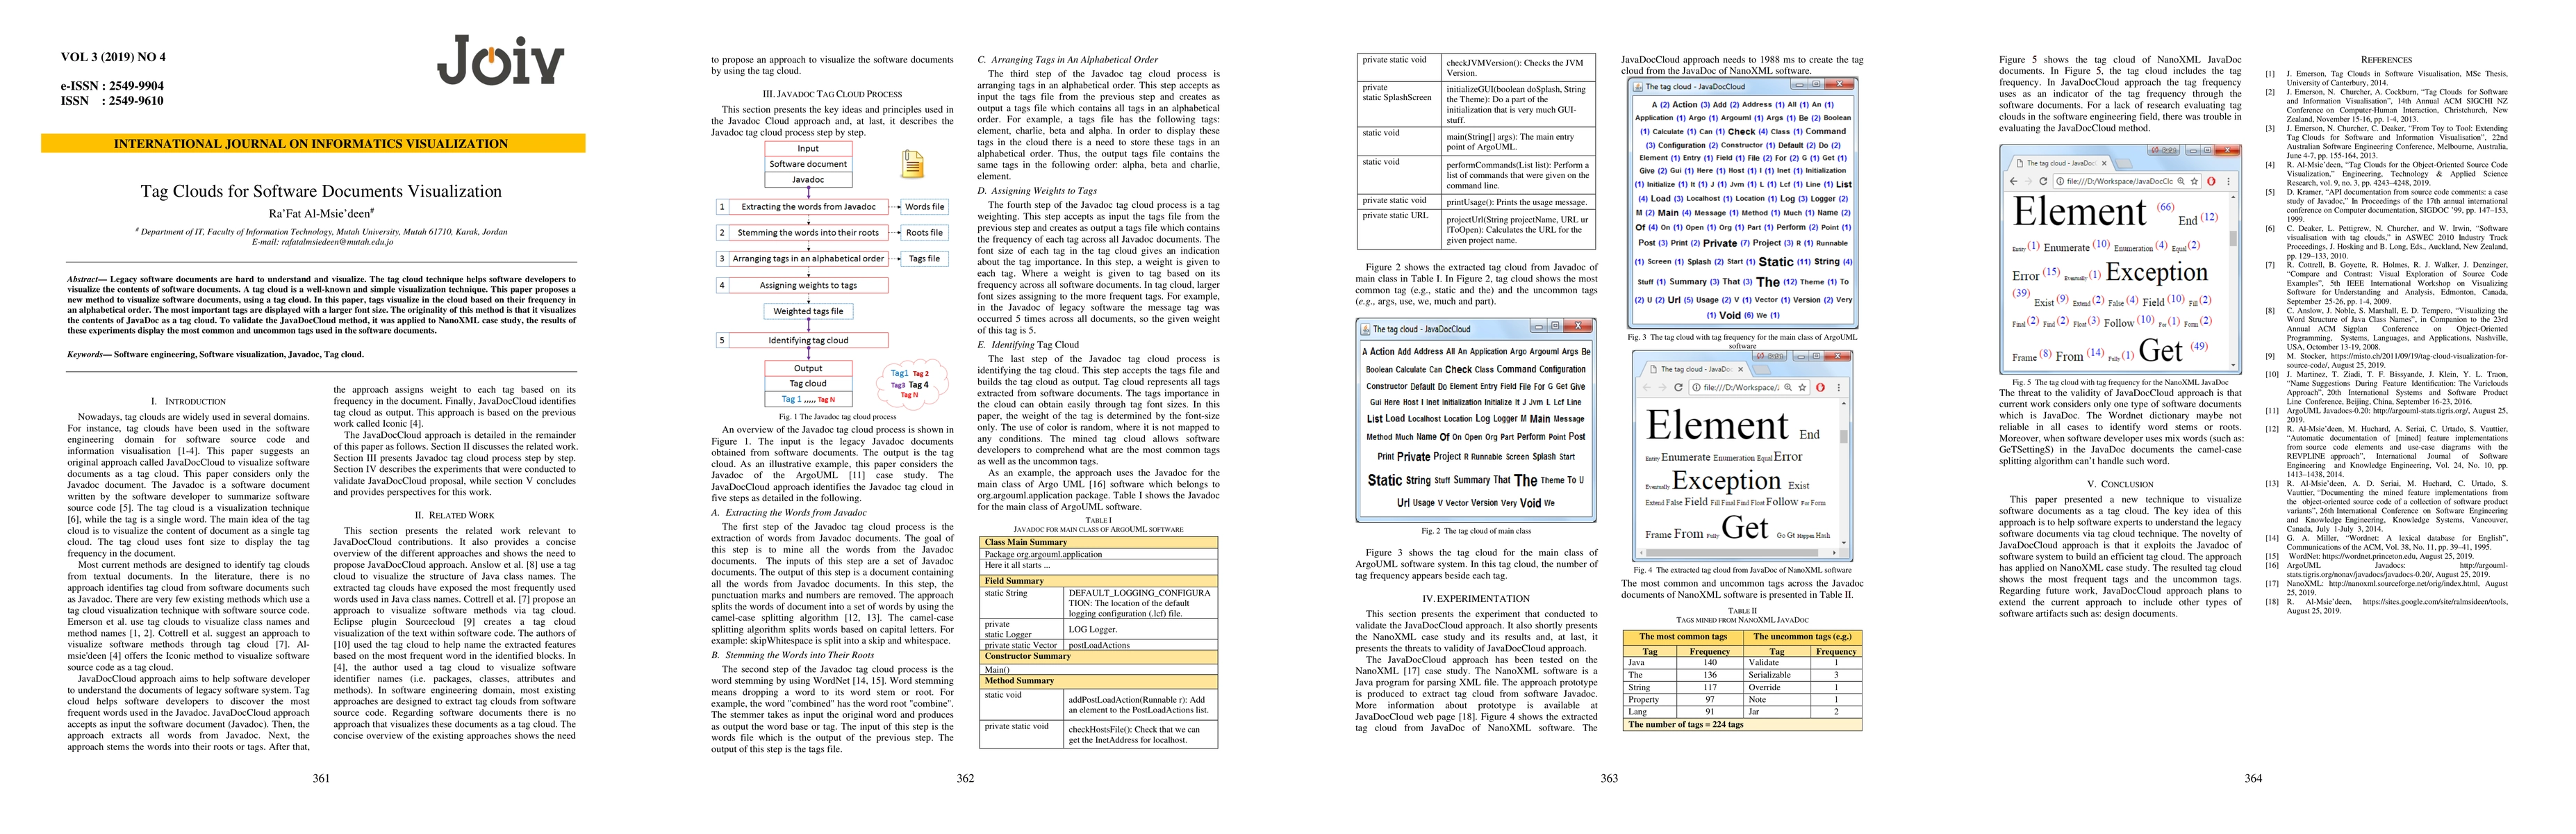
Legacy software documents are hard to understand and visualize. The tag cloud technique helps software developers to visualize the contents of software documents. A tag cloud is a well-known and simple visualization technique. This paper proposes a new method to visualize software documents, using a tag cloud. In this paper, tags visualize in the cloud based on their frequency in an alphabetical order. The most important tags are displayed with a larger font size. The originality of this method is that it visualizes the contents of JavaDoc as a tag cloud. To validate the JavaDocCloud method, it was applied to NanoXML case study, the results of these experiments display the most common and uncommon tags used in the software documents.
AI Key Findings
Get AI-generated insights about this paper's methodology, results, significance, and more — seven facets brought into focus.
Impact
Paper Details
Authors
PDF Preview
Key Terms
Citation Network
Current paper (gray), citations (green), references (blue)
Display is limited for performance on very large graphs.
Discussion 0