Quick Summary:

Taggle is a tabular visualization technique that balances overview and detail, allowing users to explore individual items within large tables with data-driven aggregation and analysis capabilities.

Summary

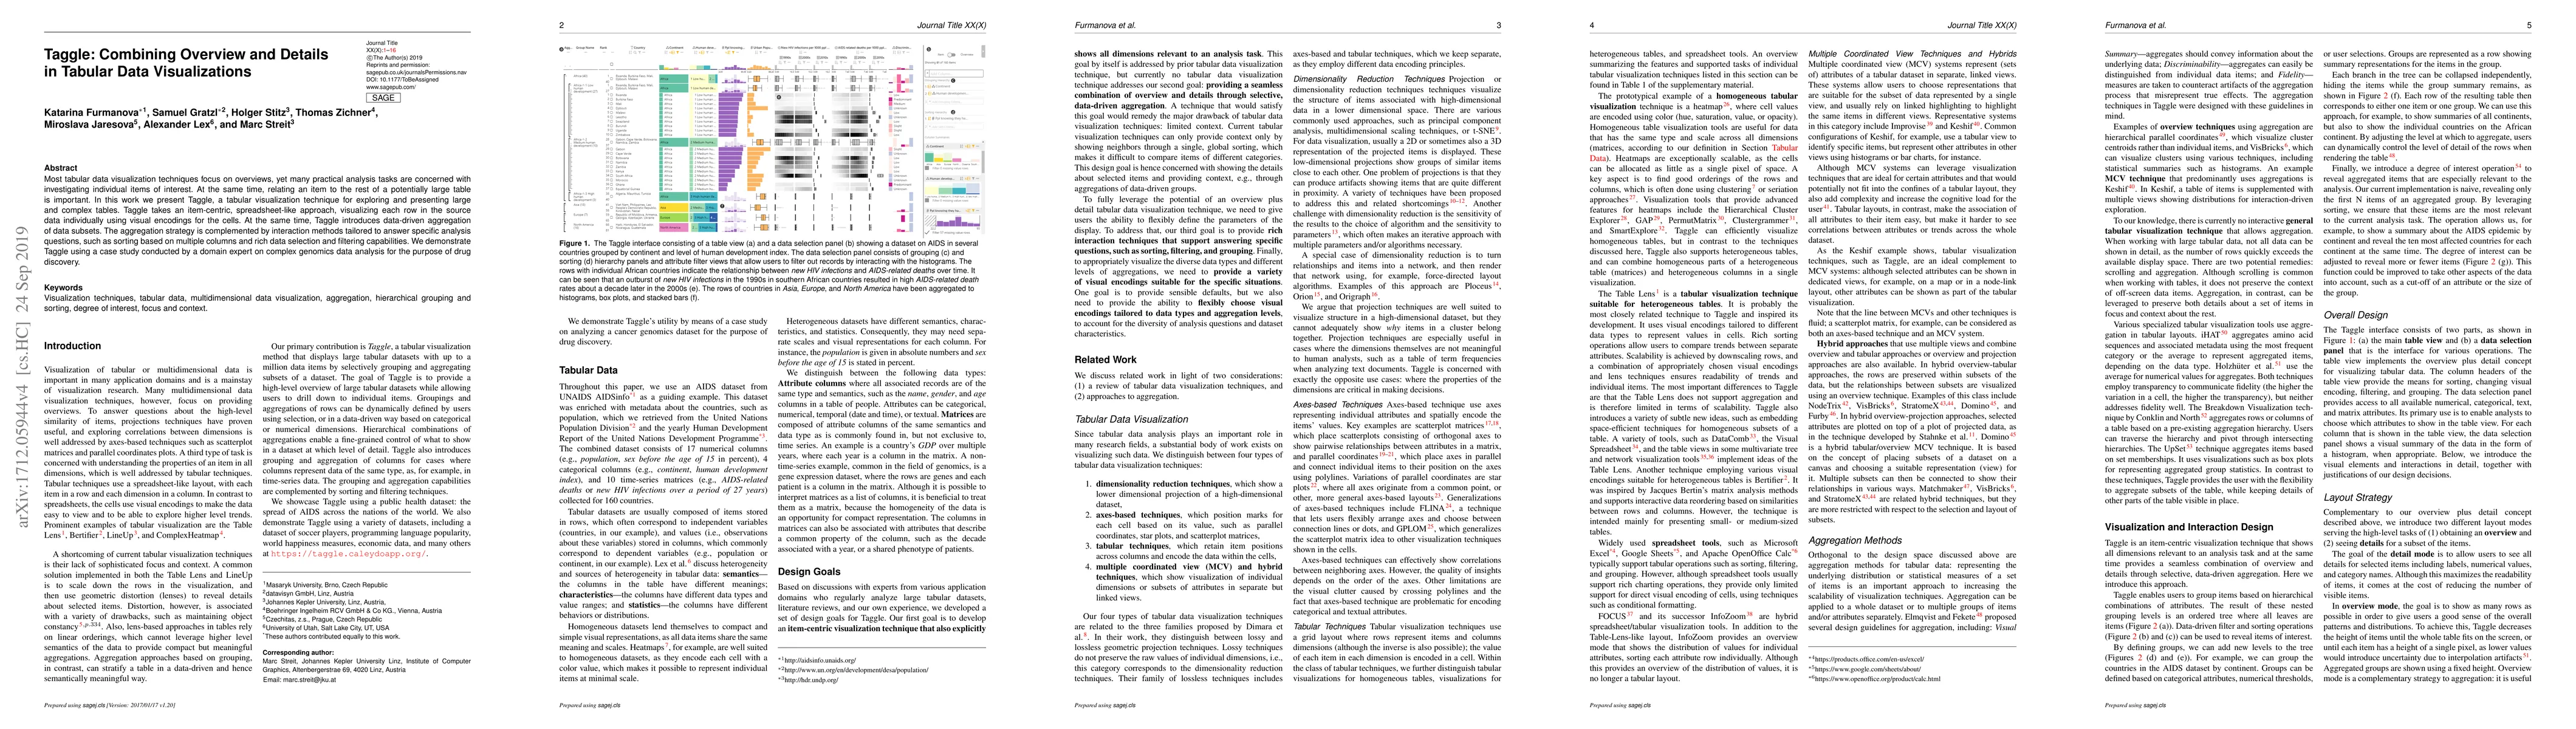
Most tabular data visualization techniques focus on overviews, yet many practical analysis tasks are concerned with investigating individual items of interest. At the same time, relating an item to the rest of a potentially large table is important. In this work we present Taggle, a tabular visualization technique for exploring and presenting large and complex tables. Taggle takes an item-centric, spreadsheet-like approach, visualizing each row in the source data individually using visual encodings for the cells. At the same time, Taggle introduces data-driven aggregation of data subsets. The aggregation strategy is complemented by interaction methods tailored to answer specific analysis questions, such as sorting based on multiple columns and rich data selection and filtering capabilities. We demonstrate Taggle using a case study conducted by a domain expert on complex genomics data analysis for the purpose of drug discovery.

AI Key Findings

Get AI-generated insights about this paper's methodology, results, and significance.

Paper Details

PDF Preview

Download PDF

Key Terms

item (0.275)
aggregation (0.251)
data (0.170)
items (0.166)
row (0.160)
drug (0.157)
relating (0.156)
expert (0.156)
table (0.153)
complex (0.148)
analysis (0.148)
subsets (0.146)
case study (0.145)
concerned (0.145)
data analysis (0.144)
tailored (0.144)
work present (0.140)
data driven (0.140)
filtering (0.140)
investigating (0.140)

Citation Network

Current paper (gray), citations (green), references (blue)

Current Paper
Citations
References
Click to view
Title Authors Year Actions
VisArena: A testbed for visualization with synthetic data tables
Siwei Fu, Junjie Jin, Qi Ma, Zhongsu Luo, Kai Xiong, Yingcai Wu
2025
View Paper
HAXplorer: Interactive visual exploration of hierarchical item and attribute spaces
Michael Blum, Jonas Blum, M. Sachdeva, Jurgen Bernard
2025
View Paper
How Novices Use Program Visualizations to Understand Code that Manipulates Data Tables
Ylesia Wu, Qirui Zheng, Sam Lau
2025
View Paper
ConfusionLens: Focus+Context Visualization Interface for Performance Analysis of Multiclass Image Classifiers
Kazuyuki Fujita, Keito Uwaseki, Hongyu Bu, Kazuki Takashima, Y. Kitamura
2024
View Paper
The Effect of Visual Aids on Reading Numeric Data Tables
Yongfeng Ji, Charles Perin, Miguel A. Nacenta
2024
View Paper
Zoomable Level-of-Detail ChartTables for Interpreting Probabilistic Model Outputs for Reactionary Train Delays
A. Slingsby, Jonathan Hyde
2024
View Paper
CausalPrism: A Visual Analytics Approach for Subgroup-based Causal Heterogeneity Exploration
Jiehui Zhou, Xumeng Wang, Wong Kam-Kwai, Wei Zhang, Xingyu Liu, Juntian Zhang, Minfeng Zhu, Wei Chen
2024
View Paper
SMARTable: Synchronize Mobile Devices and Augmented Reality for Table Visualization
Xiaoliang Wang, Yu Zhou, Ye Liu, Fengming Liu, Zirong Zheng, Zhongkai Wang, Weijiao Zhang, Guozheng Li, Chi Harold Liu
2024
View Paper
A User-Centered Perspective on Information Needs of Stakeholders in the Circular Economy
Anne Preut, Tobias Mertz, Lena Cibulski, Ján Kopka
2024
View Paper
Flexible Visual Preference Inspection in Group Decision Making
Jordon Johnson, Spencer Yao, G. Carenini, Jonathan B. Evans
2024
View Paper
MoNetExplorer: A Visual Analytics System for Analyzing Dynamic Networks With Temporal Network Motifs
Seokweon Jung, DongHwa Shin, Hyeon Jeon, Kiroong Choe, Jinwook Seo
2023
View Paper
InVADo: Interactive Visual Analysis of Molecular Docking Data
M. Schäfer, N. Brich, J. Byška, Sérgio M. Marques, D. Bednář, Philipp Thiel, B. Kozlíková, Michael Krone
2023
View Paper
Transitioning to a Commercial Dashboarding System: Socio-Technical Observations and Opportunities
C. Walchshofer, Vaishali Dhanoa, Marc Streit, Miriah Meyer
2023
View Paper
V: Visual Aids for Identifying and Interpreting Spurious Associations in Data-Driven Decisions
Xian Teng, Yongsu Ahn, Y. Lin
2023
View Paper
Ferret: Reviewing Tabular Datasets for Manipulation
Devin Lange, Shaurya Sahai, J. M. Phillips, A. Lex
2023
View Paper
SuperNOVA: Design Strategies and Opportunities for Interactive Visualization in Computational Notebooks
Zijie J. Wang, David Munechika, Seongmin Lee, Duen Horng Chau
2023
View Paper
TimberSleuth: Visual anomaly detection with human feedback for mitigating the illegal timber trade
Debanjan Datta, Nathan Self, J. Simeone, A. Meadows, Willow Outhwaite, Linda Walker, N. Elmqvist, Naren Ramkrishnan
2023
View Paper
Inventa: A computational tool to discover structural novelty in natural extracts libraries
L. Quirós-Guerrero, Louis-Félix Nothias, A. Gaudry, L. Marcourt, Pierre-Marie Allard, Adriano Rutz, B. David, E. Queiroz, J. Wolfender
2022
View Paper
ClassMat: a Matrix of Small Multiples to Analyze the Topology of Multiclass Multidimensional Data
Michaël Aupetit, A. Ali, Abdelkader Baggag, H. Bensmail
2022
View Paper
Inventa: a computational tool to discover chemical novelty in natural extracts libraries
L. Quirós-Guerrero, Louis-Félix Nothias, A. Gaudry, L. Marcourt, Pierre-Marie Allard, Adriano Rutz, B. David, E. Queiroz, J. Wolfender
2022
View Paper
Diff in the Loop: Supporting Data Comparison in Exploratory Data Analysis
April Yi Wang, Will Epperson, R. Deline, S. Drucker
2022
View Paper
Predicting intent behind selections in scatterplot visualizations
K. Gadhave, Jochen Görtler, Zach Cutler, C. Nobre, O. Deussen, Miriah D. Meyer, J. M. Phillips, A. Lex
2021
View Paper
Untidy Data: The Unreasonable Effectiveness of Tables
L. Bartram, M. Correll, Melanie Tory
2021
View Paper
Coral: a web-based visual analysis tool for creating and characterizing cohorts
Patrick Adelberger, Klaus Eckelt, Markus J. Bauer, M. Streit, C. Haslinger, T. Zichner
2021
View Paper
Sanguine: Visual analysis for patient blood management
Haihan Lin, R. Metcalf, Jack Wilburn, A. Lex
2020
View Paper
ChemVA: Interactive Visual Analysis of Chemical Compound Similarity in Virtual Screening
María Virginia Sabando, Pavol Ulbrich, M. Selzer, Jan Byvska, Jan Mivcan, I. Ponzoni, Axel J. Soto, M. L. Ganuza, Barbora Kozl'ikov'a
2020
View Paper
InstanceFlow: Visualizing the Evolution of Classifier Confusion at the Instance Level
Michael Pühringer, A. Hinterreiter, M. Streit
2020
View Paper
Technical Threat Intelligence Analytics: What and How to Visualize for Analytic Process
Robertas Damasevicius, Jevgenijus Toldinas, Algimantas Venčkauskas, Šarūnas Grigaliūnas, Nerijus Morkevičius
2020
View Paper
Origraph: Interactive Network Wrangling
Alex Bigelow, C. Nobre, Miriah D. Meyer, A. Lex
2018
View Paper
Human-computer interaction for virtual-real fusion
Jianhua Tao, Jiangtao Gong, Gao Nan, Fu Siwei, Liang Shan, Yu Chun
2023
View Paper
A Visual Tool for Interactively Privacy Analysis and Preservation on Order-Dynamic Tabular Data
Fengzhou Liang, F. Liu, Tongqing Zhou
2022
View Paper
TableRepoViz: Visualizing Tabular Data Repositories for Facilitating Descriptive Tag Augmentation
Jian Cao
2022
View Paper
FERRET: REVIEWING TABULAR DATASETS
Shaurya Sahai, J. M. Phillips
2022
View Paper
VisArch: Visualisation of Performance-based Architectural Refactorings
Catia Trubiani, A. Aleti, Sarah Goodwin, Pooyan Jamshidi, A. Hoorn, S. Gratzl
2020
View Paper
Visual programming environment based on data visualization grammar specification
E. Ivanov, A. Khoroshavin, A. Karsakov
2020
View Paper
Configuration Finder: A Tidy Visual Interface for Effective Faceted Search
P. Riehmann, Andreas Schädler, J. Harder, J. Herpel, B. Fröhlich
2020
View Paper
Reflections, Models, and Software for Iterative Visualization Design
Alex Bigelow
2019
View Paper

Comments (0)

This website uses cookies to ensure you get the best experience. Learn more