Publication
Metrics
AI Quick Summary
This paper extends the Andrienko framework for visual tasks in Exploratory Data Analysis to temporal graph data, resulting in a comprehensive list of over 144 attribute-based tasks. The detailed task taxonomy is provided in the document due to its extensive size.
Paper Preview
Abstract
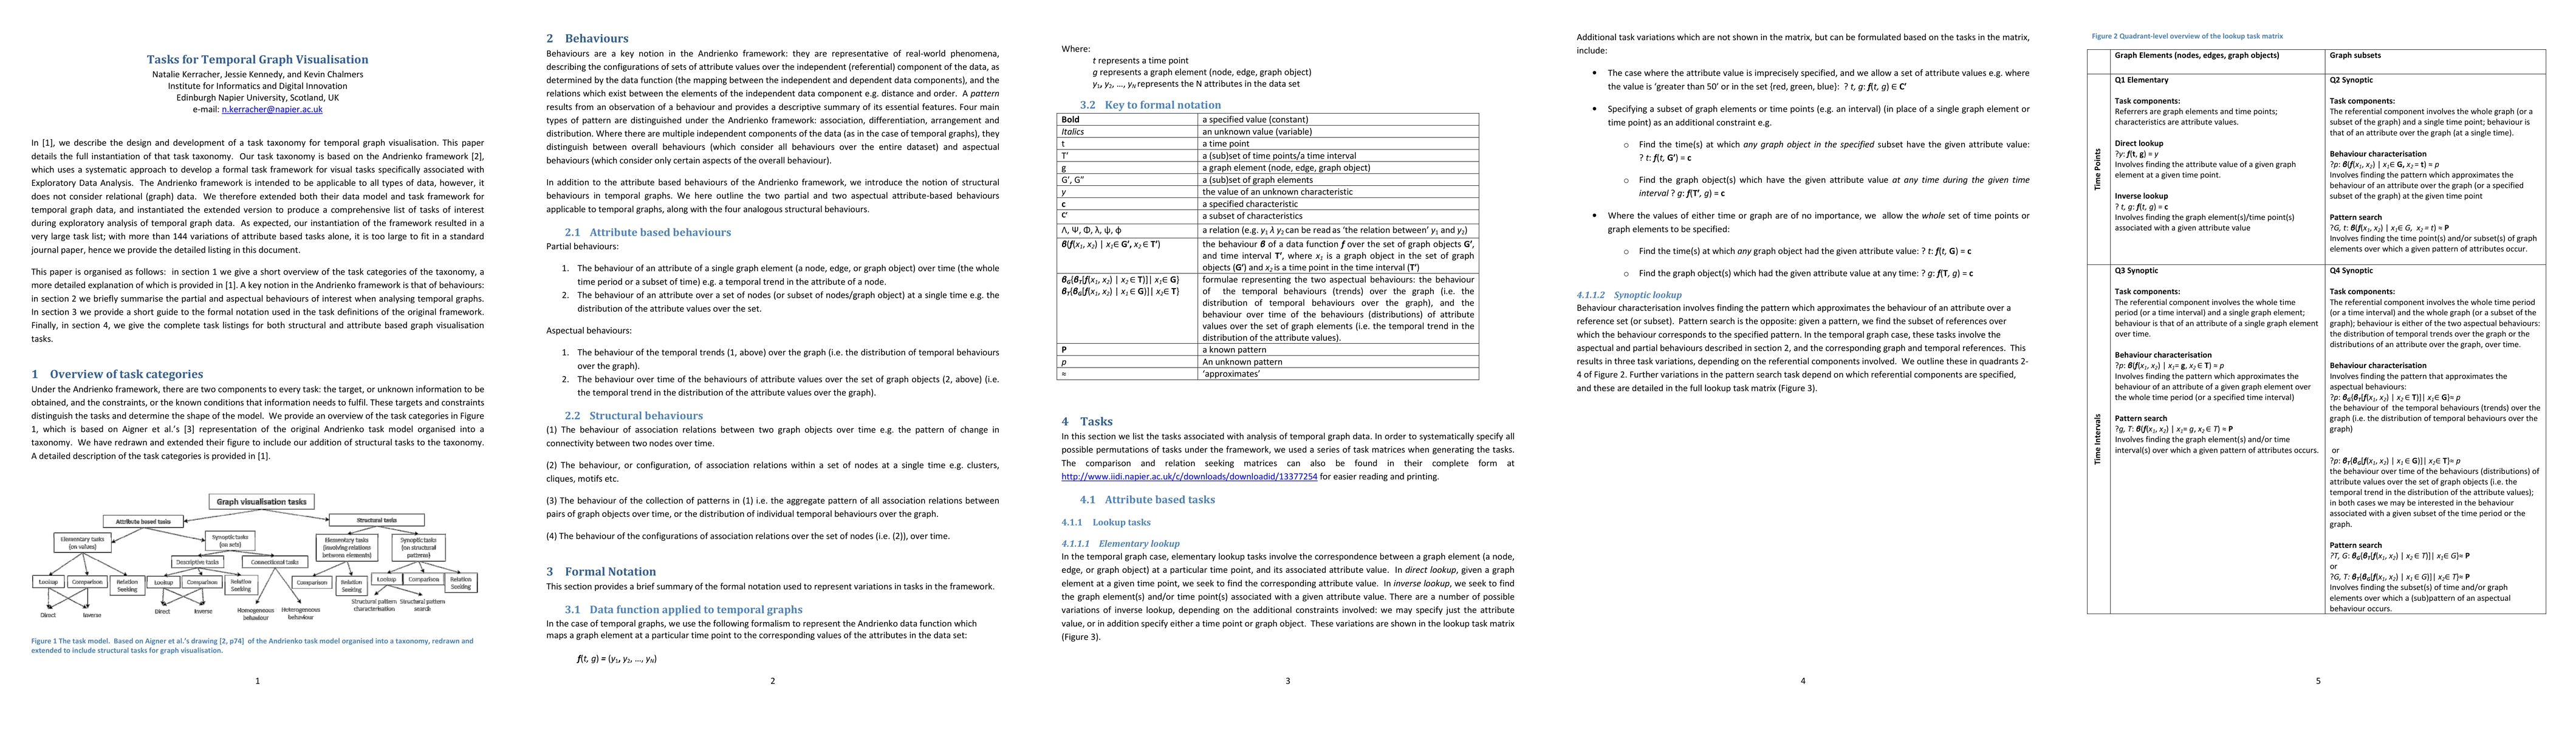
In [1], we describe the design and development of a task taxonomy for temporal graph visualisation. This paper details the full instantiation of that task taxonomy. Our task taxonomy is based on the Andrienko framework [2], which uses a systematic approach to develop a formal task framework for visual tasks specifically associated with Exploratory Data Analysis. The Andrienko framework is intended to be applicable to all types of data, however, it does not consider relational (graph) data. We therefore extended both their data model and task framework for temporal graph data, and instantiated the extended version to produce a comprehensive list of tasks of interest during exploratory analysis of temporal graph data. As expected, our instantiation of the framework resulted in a very large task list; with more than 144 variations of attribute based tasks alone, it is too large to fit in a standard journal paper, hence we provide the detailed listing in this document.
AI Key Findings
Get AI-generated insights about this paper's methodology, results, significance, and more — seven facets brought into focus.
Impact
Paper Details
PDF Preview
Key Terms
Citation Network
Current paper (gray), citations (green), references (blue)
Display is limited for performance on very large graphs.
Discussion 0