TBSSvis: Visual Analytics for Temporal Blind Source Separation
Publication
Metrics
AI Quick Summary
TBSSvis is a web-based visual analytics tool designed to enhance the analysis of Temporal Blind Source Separation (TBSS) results, providing interactive visualizations that support the complex tasks involved in interpreting noisy temporal data. The tool was developed through a user-centered design process and was evaluated positively by TBSS experts for its ability to facilitate the analysis and comparison of diverse TBSS results.
Paper Preview
Abstract
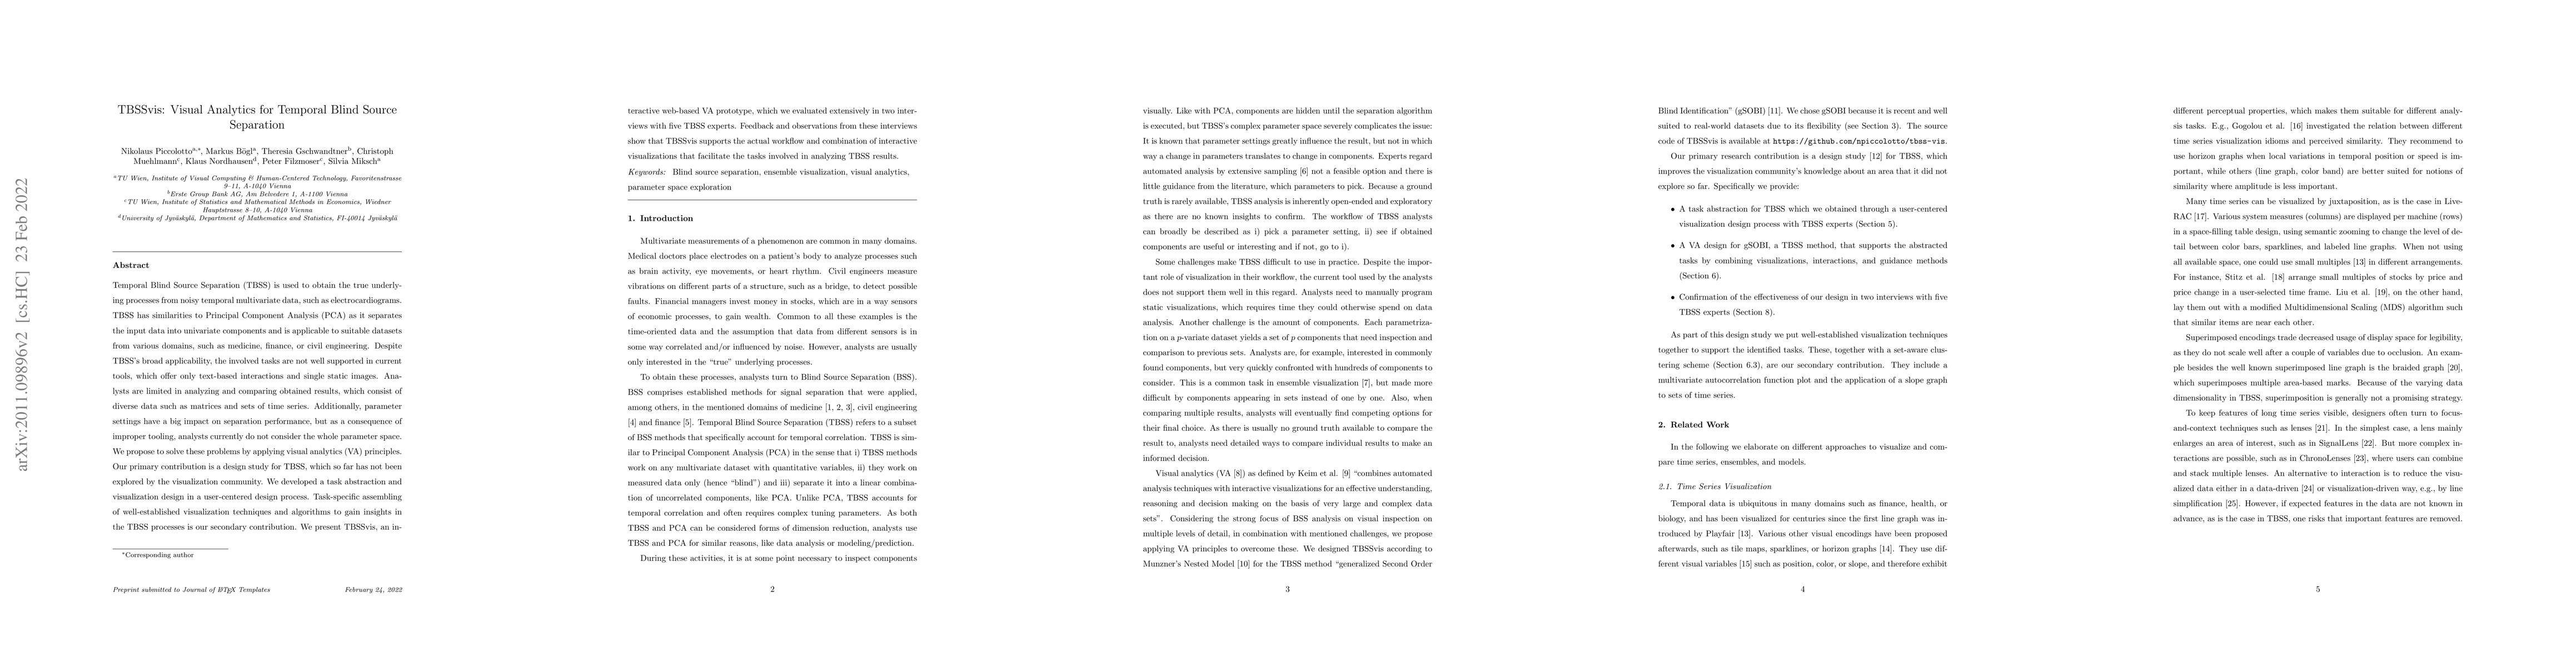
Temporal Blind Source Separation (TBSS) is used to obtain the true underlying processes from noisy temporal multivariate data, such as electrocardiograms. TBSS has similarities to Principal Component Analysis (PCA) as it separates the input data into univariate components and is applicable to suitable datasets from various domains, such as medicine, finance, or civil engineering. Despite TBSS's broad applicability, the involved tasks are not well supported in current tools, which offer only text-based interactions and single static images. Analysts are limited in analyzing and comparing obtained results, which consist of diverse data such as matrices and sets of time series. Additionally, parameter settings have a big impact on separation performance, but as a consequence of improper tooling, analysts currently do not consider the whole parameter space. We propose to solve these problems by applying visual analytics (VA) principles. Our primary contribution is a design study for TBSS, which so far has not been explored by the visualization community. We developed a task abstraction and visualization design in a user-centered design process. Task-specific assembling of well-established visualization techniques and algorithms to gain insights in the TBSS processes is our secondary contribution. We present TBSSvis, an interactive web-based VA prototype, which we evaluated extensively in two interviews with five TBSS experts. Feedback and observations from these interviews show that TBSSvis supports the actual workflow and combination of interactive visualizations that facilitate the tasks involved in analyzing TBSS results.
AI Key Findings
Get AI-generated insights about this paper's methodology, results, significance, and more — seven facets brought into focus.
Impact
Paper Details
Authors
PDF Preview
Key Terms
Citation Network
Current paper (gray), citations (green), references (blue)
Display is limited for performance on very large graphs.
Discussion 0