Teaching and Learning Data Visualization: Ideas and Assignments
Publication
Metrics
Paper Preview
Abstract
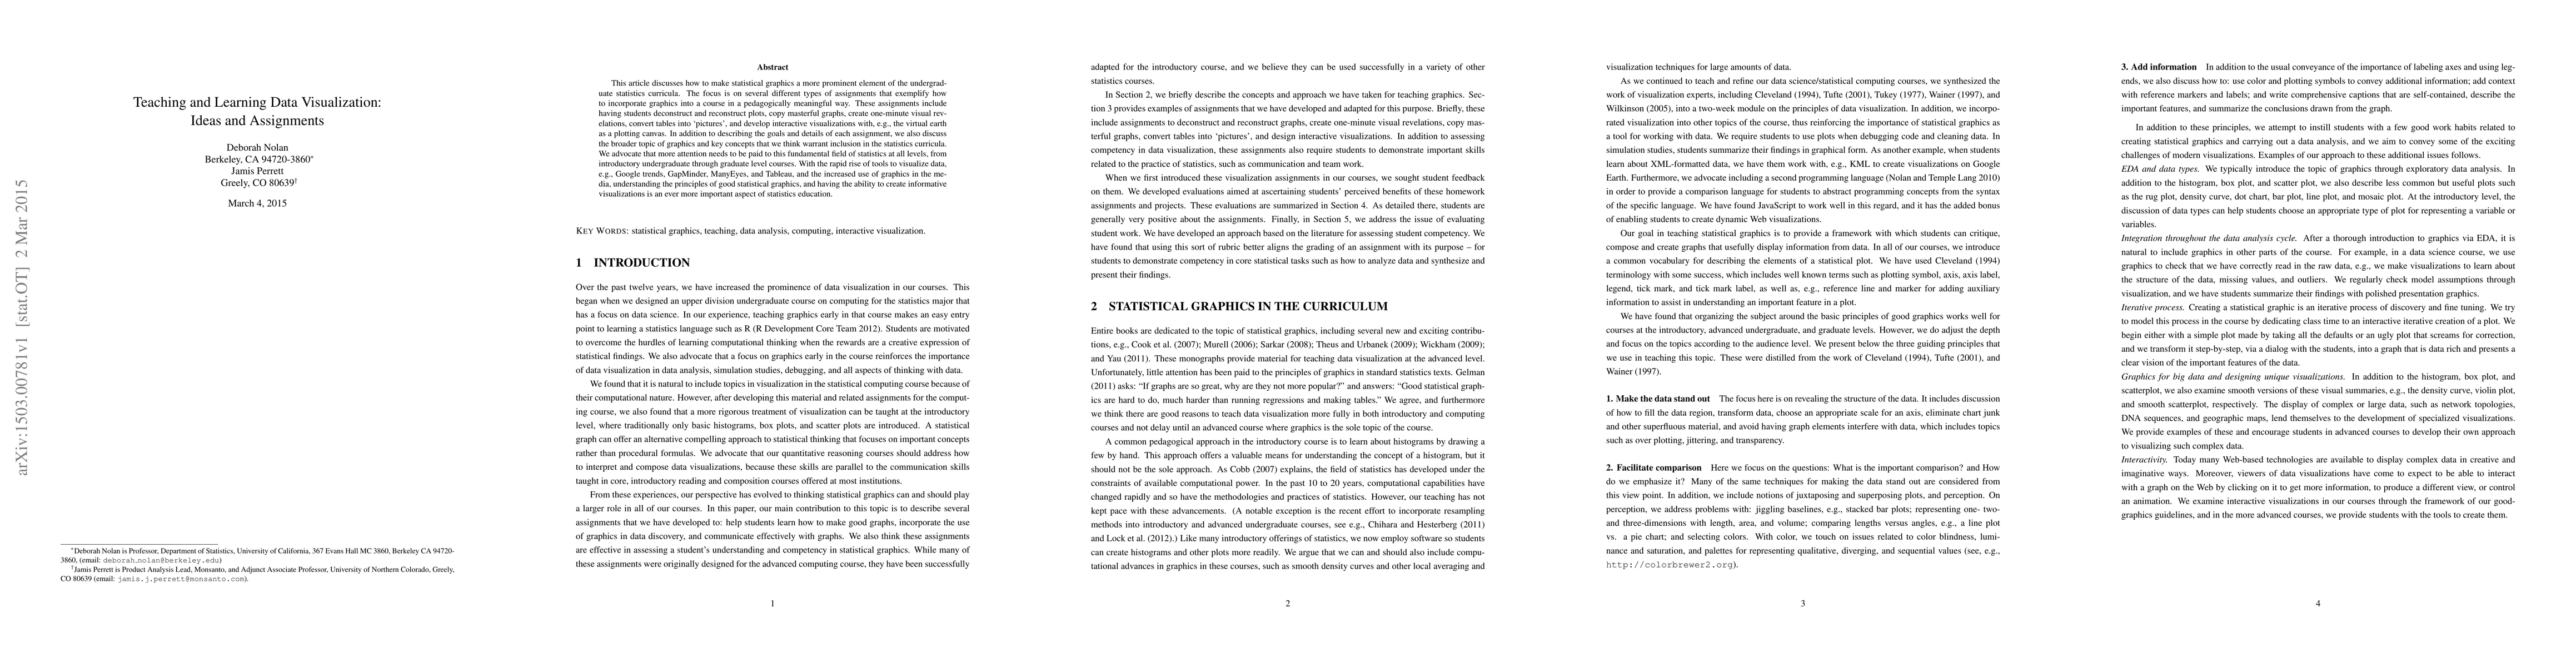
This article discusses how to make statistical graphics a more prominent element of the undergraduate statistics curricula. The focus is on several different types of assignments that exemplify how to incorporate graphics into a course in a pedagogically meaningful way. These assignments include having students deconstruct and reconstruct plots, copy masterful graphs, create one-minute visual revelations, convert tables into `pictures', and develop interactive visualizations with, e.g., the virtual earth as a plotting canvas. In addition to describing the goals and details of each assignment, we also discuss the broader topic of graphics and key concepts that we think warrant inclusion in the statistics curricula. We advocate that more attention needs to be paid to this fundamental field of statistics at all levels, from introductory undergraduate through graduate level courses. With the rapid rise of tools to visualize data, e.g., Google trends, GapMinder, ManyEyes, and Tableau, and the increased use of graphics in the media, understanding the principles of good statistical graphics, and having the ability to create informative visualizations is an ever more important aspect of statistics education.
AI Key Findings
Get AI-generated insights about this paper's methodology, results, significance, and more — seven facets brought into focus.
Impact
Paper Details
PDF Preview
Key Terms
Citation Network
Current paper (gray), citations (green), references (blue)
Display is limited for performance on very large graphs.
Discussion 0