Publication
Metrics
AI Quick Summary
This paper proposes using mosaic plots as a graphical method to teach Bayes' Rule, arguing that this approach better visualizes conditional probabilities compared to traditional tree diagrams. The authors demonstrate that mosaic plots effectively help students understand the sample space and associated probabilities in Bayes' Rule.
Paper Preview
Abstract
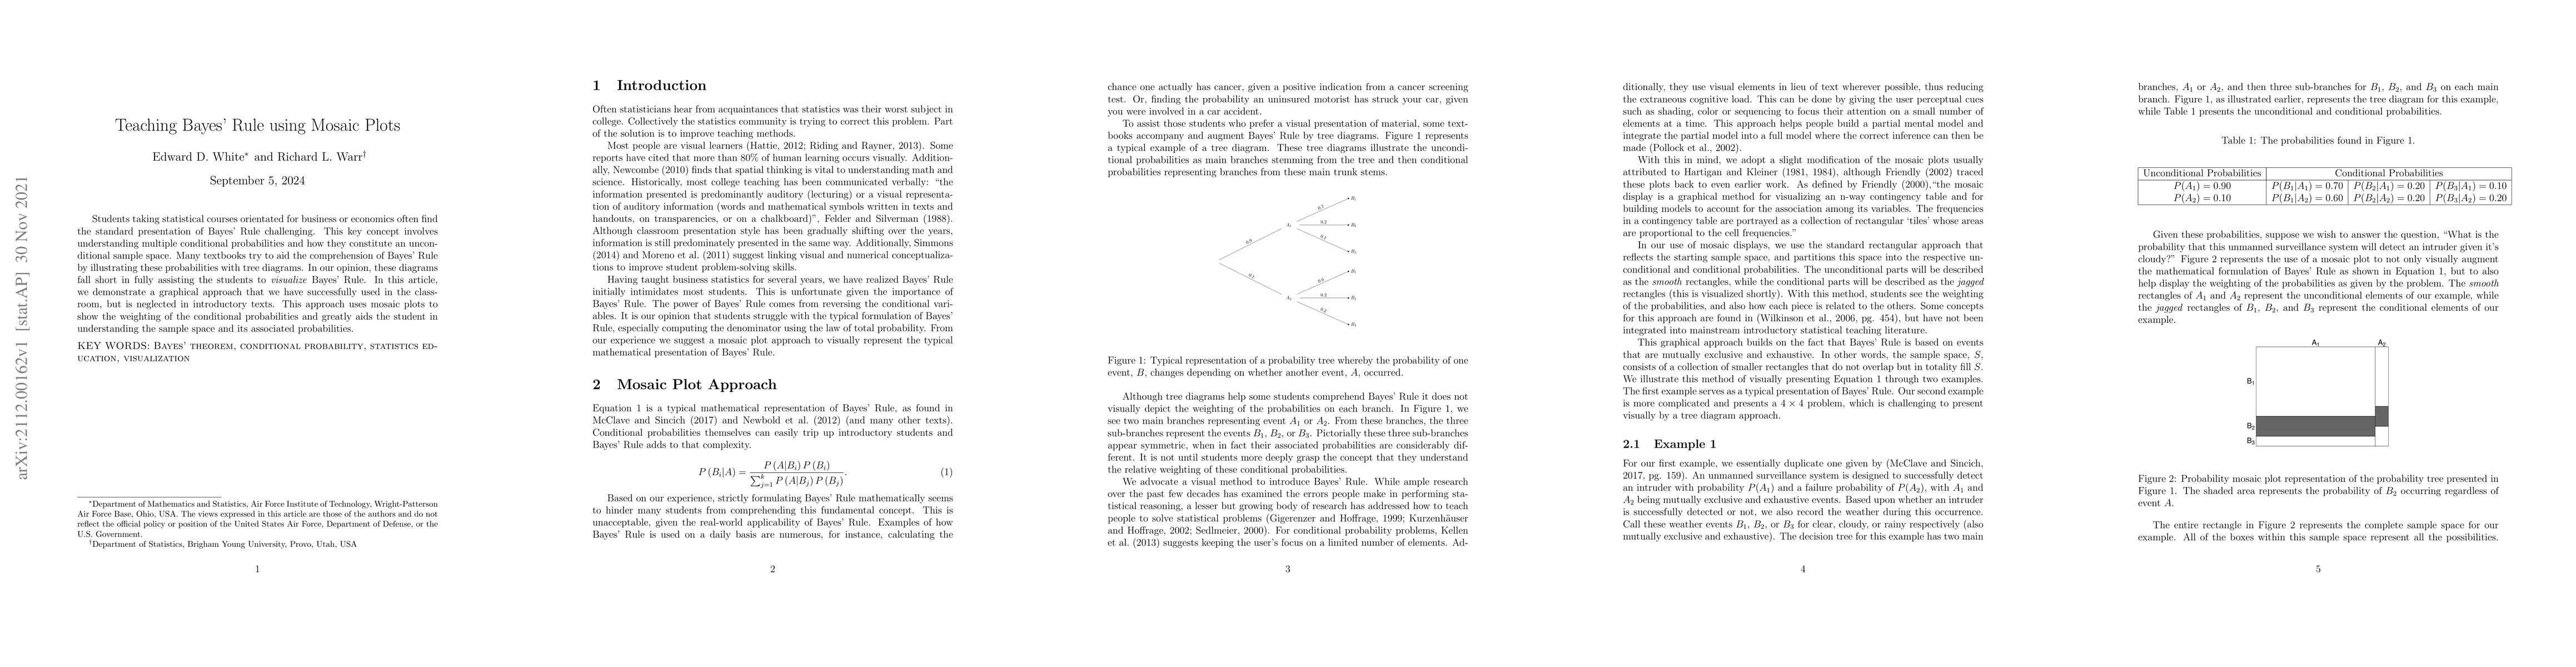
Students taking statistical courses orientated for business or economics often find the standard presentation of Bayes' Rule challenging. This key concept involves understanding multiple conditional probabilities and how they constitute an unconditional sample space. Many textbooks try to aid the comprehension of Bayes' Rule by illustrating these probabilities with tree diagrams. In our opinion, these diagrams fall short in fully assisting the students to visualize Bayes' Rule. In this article, we demonstrate a graphical approach that we have successfully used in the classroom, but is neglected in introductory texts. This approach uses mosaic plots to show the weighting of the conditional probabilities and greatly aids the student in understanding the sample space and its associated probabilities.
AI Key Findings
Get AI-generated insights about this paper's methodology, results, significance, and more — seven facets brought into focus.
Impact
Paper Details
Authors
PDF Preview
Key Terms
Citation Network
Current paper (gray), citations (green), references (blue)
Display is limited for performance on very large graphs.
Discussion 0