TECVis: A Visual Analytics Tool to Compare People's Emotion Feelings
Publication
Metrics
AI Quick Summary
TECVis is a visual analytics tool designed to compare people's emotion feelings in tweets based on geolocations or timestamps. It offers interaction and filtering options for navigating and exploring tweet data for effective emotion analysis.
Paper Preview
Abstract
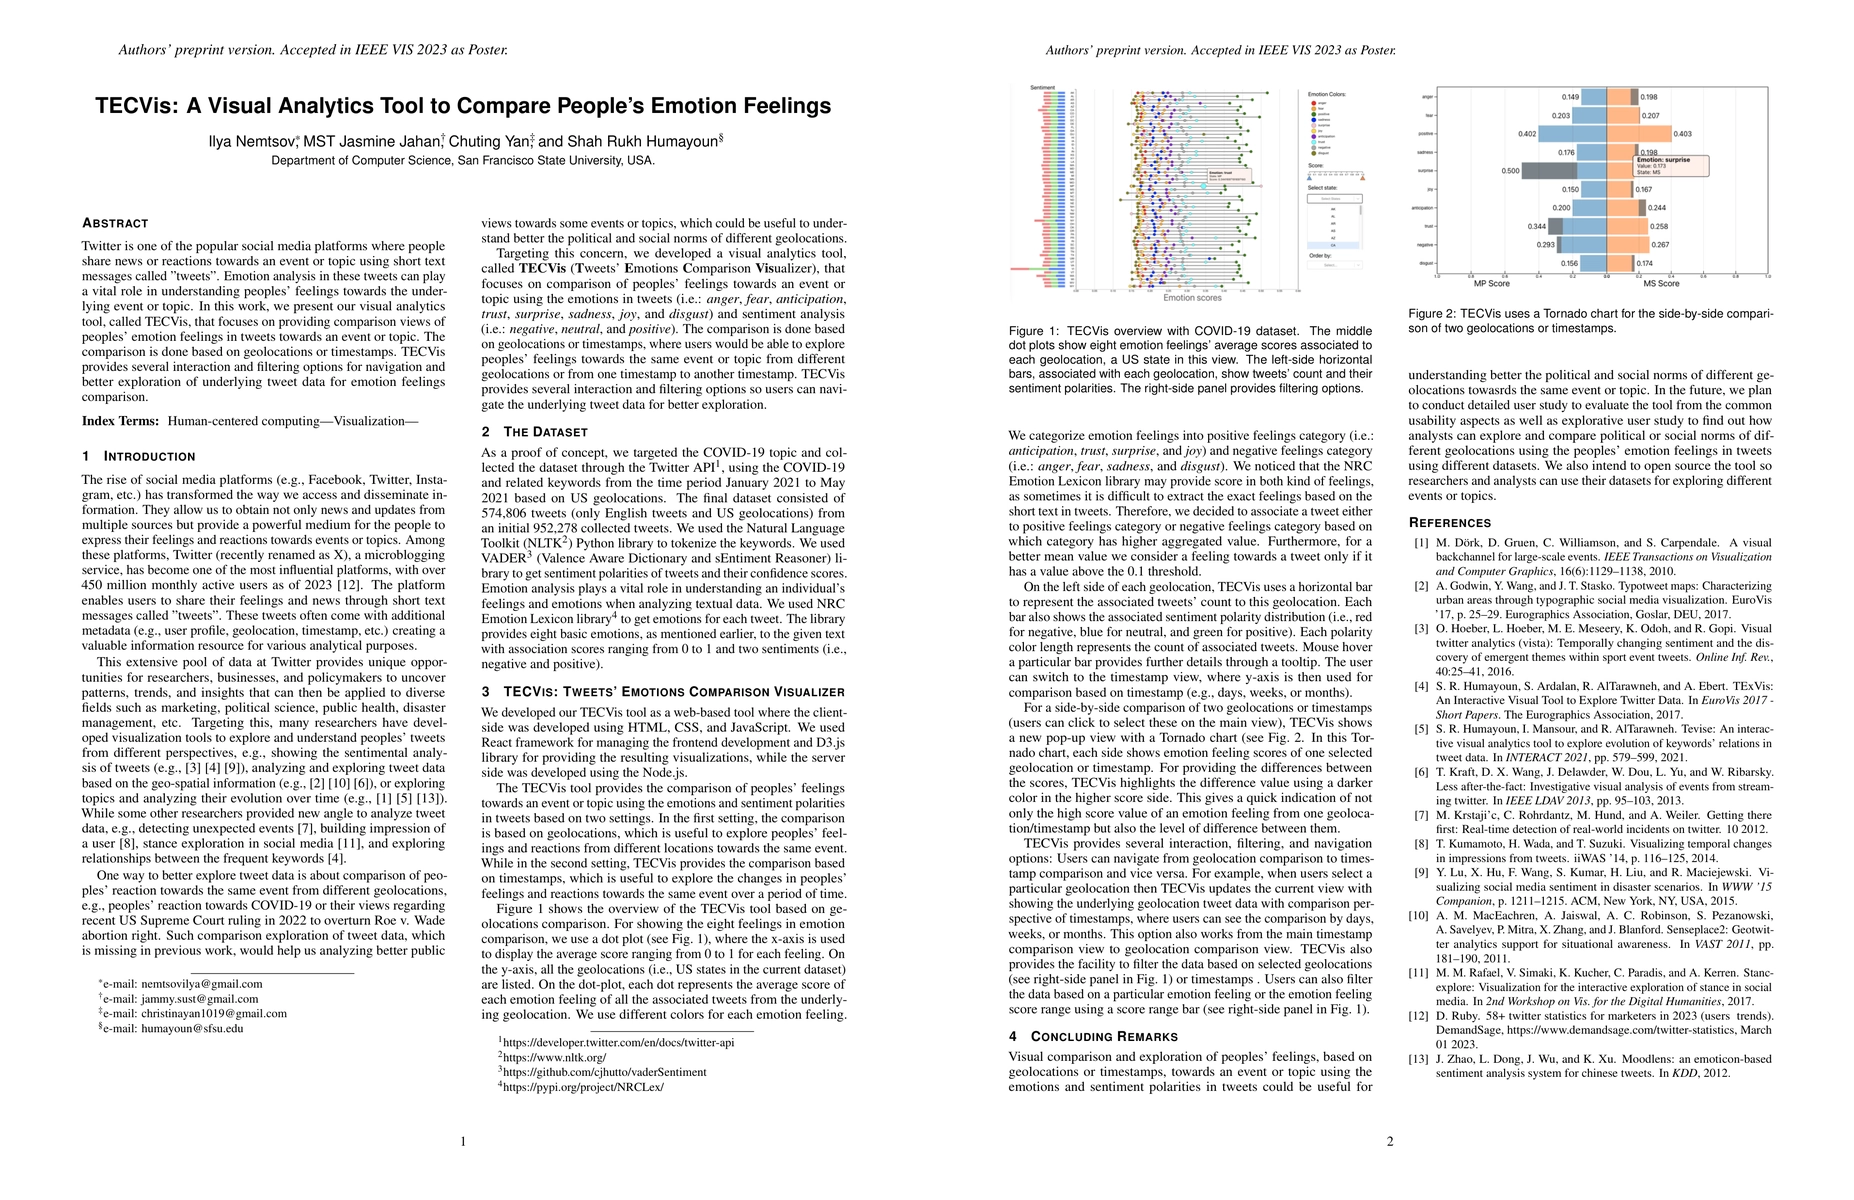
Twitter is one of the popular social media platforms where people share news or reactions towards an event or topic using short text messages called "tweets". Emotion analysis in these tweets can play a vital role in understanding peoples' feelings towards the underlying event or topic. In this work, we present our visual analytics tool, called TECVis, that focuses on providing comparison views of peoples' emotion feelings in tweets towards an event or topic. The comparison is done based on geolocations or timestamps. TECVis provides several interaction and filtering options for navigation and better exploration of underlying tweet data for emotion feelings comparison.
AI Key Findings
Get AI-generated insights about this paper's methodology, results, significance, and more — seven facets brought into focus.
Impact
Paper Details
Authors
PDF Preview
Key Terms
Citation Network
Current paper (gray), citations (green), references (blue)
Display is limited for performance on very large graphs.
Discussion 0