Temperature dependence of dynamic slowing down in monatomic liquids from V-T theory
Publication
Metrics
AI Quick Summary
This paper tests the V-T theory for explaining the temperature dependence of dynamic slowing down in monatomic liquids, specifically liquid Na, by analyzing mean square displacements (MSD) at various temperatures. The theory accurately accounts for MSD data at 204.6K and shows that the "bump" in MSD at low temperatures is due to vibrational excess, confirming the theory's validity in explaining observed dynamic behaviors.
Paper Preview
Abstract
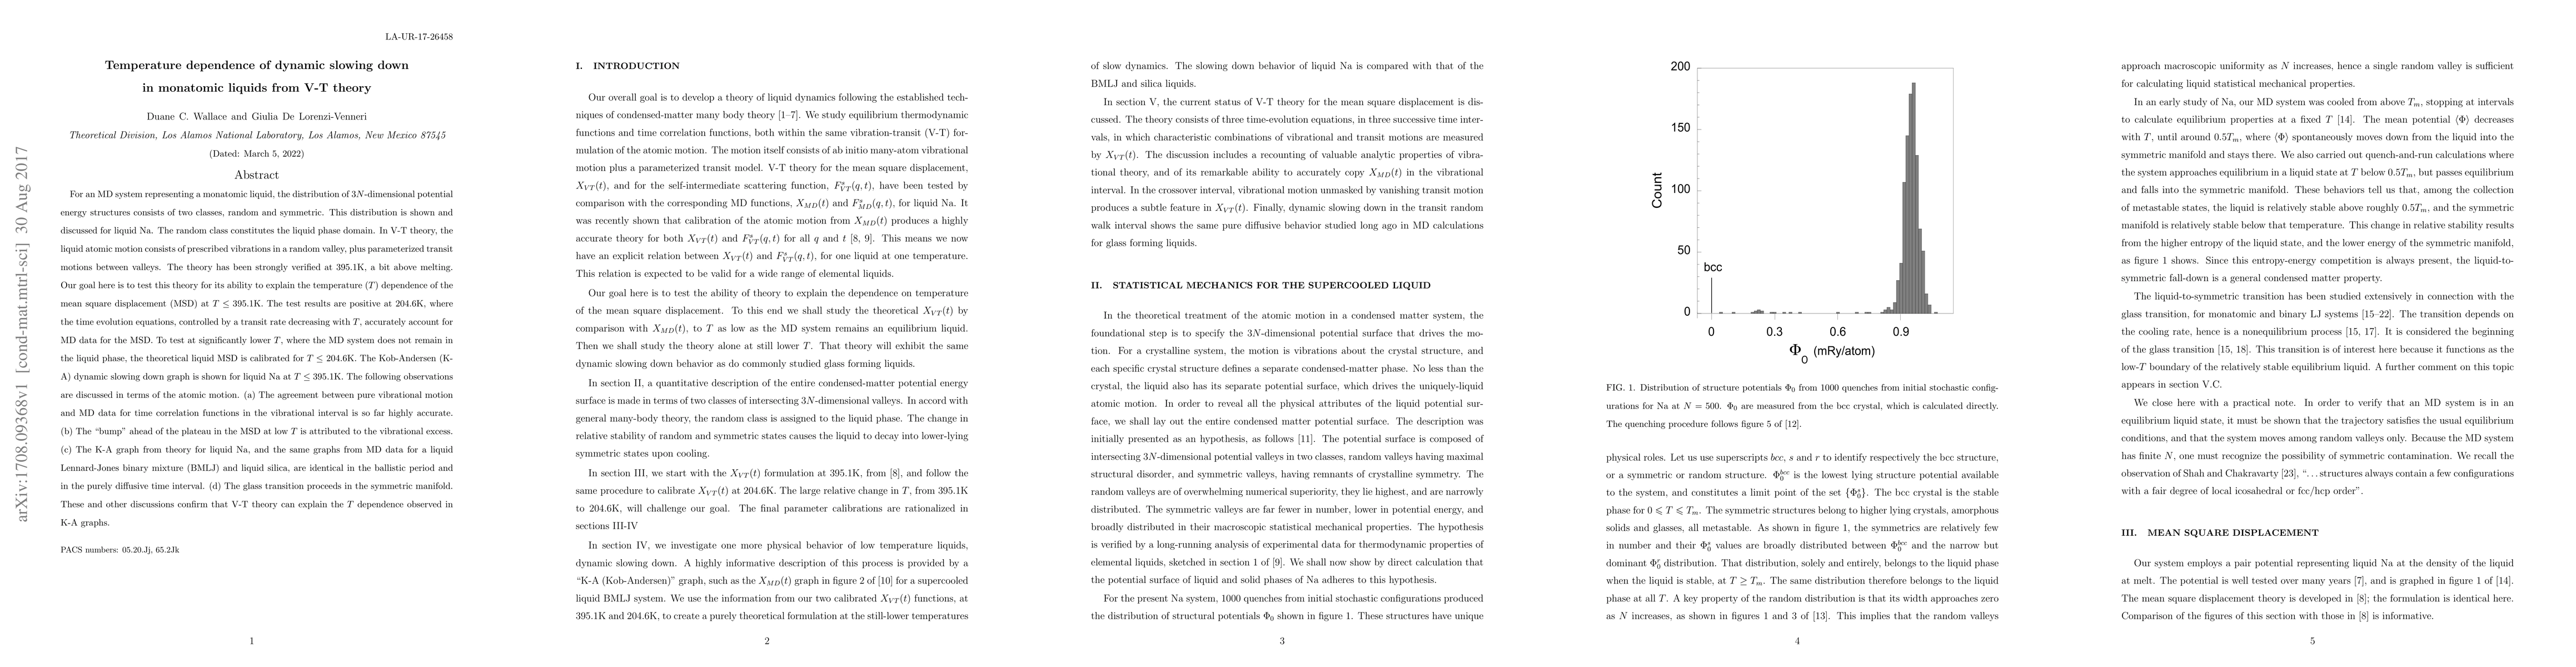
For an MD system representing a monatomic liquid, the distribution of $3N$-dimensional potential energy structures consists of two classes, random and symmetric. This distribution is shown and discussed for liquid Na. The random class constitutes the liquid phase domain. In V-T theory, the liquid atomic motion consists of prescribed vibrations in a random valley, plus parameterized transit motions between valleys. The theory has been strongly verified at 395.1K, a bit above melting. Our goal here is to test this theory for its ability to explain the temperature ($T$) dependence of the mean square displacement (MSD) at $T\leq395.1$K. The test results are positive at 204.6K, where the time evolution equations, controlled by a transit rate decreasing with $T$, accurately account for MD data for the MSD. To test at significantly lower $T$, where the MD system does not remain in the liquid phase, the theoretical liquid MSD is calibrated for $T\leq$ 204.6K. The Kob-Andersen (K-A) dynamic slowing down graph is shown for liquid Na at $T\leq395.1$K. The following observations are discussed in terms of the atomic motion. (a) The agreement between pure vibrational motion and MD data for time correlation functions in the vibrational interval is so far highly accurate. (b) The "bump" ahead of the plateau in the MSD at low $T$ is attributed to the vibrational excess. (c) The K-A graph from theory for liquid Na, and the same graphs from MD data for a liquid Lennard-Jones binary mixture (BMLJ) and liquid silica, are identical in the ballistic period and in the purely diffusive time interval. (d) The glass transition proceeds in the symmetric manifold. These and other discussions confirm that V-T theory can explain the $T$ dependence observed in K-A graphs.
AI Key Findings
Get AI-generated insights about this paper's methodology, results, significance, and more — seven facets brought into focus.
Impact
Paper Details
PDF Preview
Key Terms
Citation Network
Current paper (gray), citations (green), references (blue)
Display is limited for performance on very large graphs.
Discussion 0