The authors present a workflow to track Reeb space sheets in time-varying bivariate fields by computing Reeb spaces per timestep, retaining prominent sheets based on range-space area, and establishing inter-timestep correspondences using complementary similarity measures in the range space and domain (vertex overlap) as supporting evidence. They construct a weighted temporal graph of potential sheet correspondences and visualize it with Sankey-based layouts and linked renderings for diagnostic exploration.
Publication
Metrics
Quick Answers
What methodology did the authors use?
The authors present a workflow to track Reeb space sheets in time-varying bivariate fields by computing Reeb spaces per timestep, retaining prominent sheets based on range-space area, and establishing inter-timestep correspondences using complementary similarity measures in the range space and domain (vertex overlap) as supporting evidence. They construct a weighted temporal graph of potential sheet correspondences and visualize it with... More in Methodology →
What are the key results?
Reeb space sheet tracking reveals persistent structures and highlights intervals of temporal change in both synthetic torus and molecular electronic structure datasets. — The method identifies and preserves plausible sheet evolutions across timesteps despite possible splits/merges/disappearances, enabling analysis of feature persistence and temporal reorganization. More in Key Results →
Why is this work significant?
The work extends topological analysis to multivariate time-varying data by enabling explicit tracking of Reeb space sheets, offering a foundation for visual analysis of dynamic bivariate fields and potential insights into persistent and evolving structures in complex applications like molecular simulations. More in Significance →
What are the main limitations?
Matching is not forced to a strict one-to-one correspondence, which may require expert interpretation for ambiguous evolutions. — Reliance on range-space shapes and vertex overlap may be sensitive to noise and require careful parameter tuning for robust correspondences. More in Limitations →
Abstract
Time-varying bivariate fields arise in many scientific applications, where the relationship between two scalar quantities evolves over time. While topological methods such as merge trees provide an effective framework for identifying and tracking features in univariate data, analogous approaches for bivariate fields remain comparatively underexplored. Reeb spaces extend topological analysis to multivariate data by representing fiber connectivity through a collection of interconnected sheets, making these sheets natural candidates for describing bivariate structures. However, establishing temporal correspondences between sheets is challenging due to the structural complexity of Reeb spaces, sensitivity to noise, and the difficulty of defining meaningful similarity measures across timesteps. We present a framework for tracking Reeb space sheets in time-varying bivariate fields. The method establishes correspondences between sheets in consecutive timesteps using complementary similarity measures defined in the spatial domain and the range space. We evaluate the method on a synthetic torus dataset and two time-varying molecular electronic structure datasets. The results show that Reeb space sheet tracking reveals persistent structures and highlights interesting intervals of temporal change. Overall, the results demonstrate that Reeb space sheets can serve as trackable topological structures and provide a foundation for the visual analysis of time-varying bivariate data.
Key Findings, in focus
Seven facets of this paper, analysed and brought into focus by AI.
The work extends topological analysis to multivariate time-varying data by enabling explicit tracking of Reeb space sheets, offering a foundation for visual analysis of dynamic bivariate fields and potential insights into persistent and evolving structures in complex applications like molecular simulations.
- Reeb space sheet tracking reveals persistent structures and highlights intervals of temporal change in both synthetic torus and molecular electronic structure datasets.
- The method identifies and preserves plausible sheet evolutions across timesteps despite possible splits/merges/disappearances, enabling analysis of feature persistence and temporal reorganization.
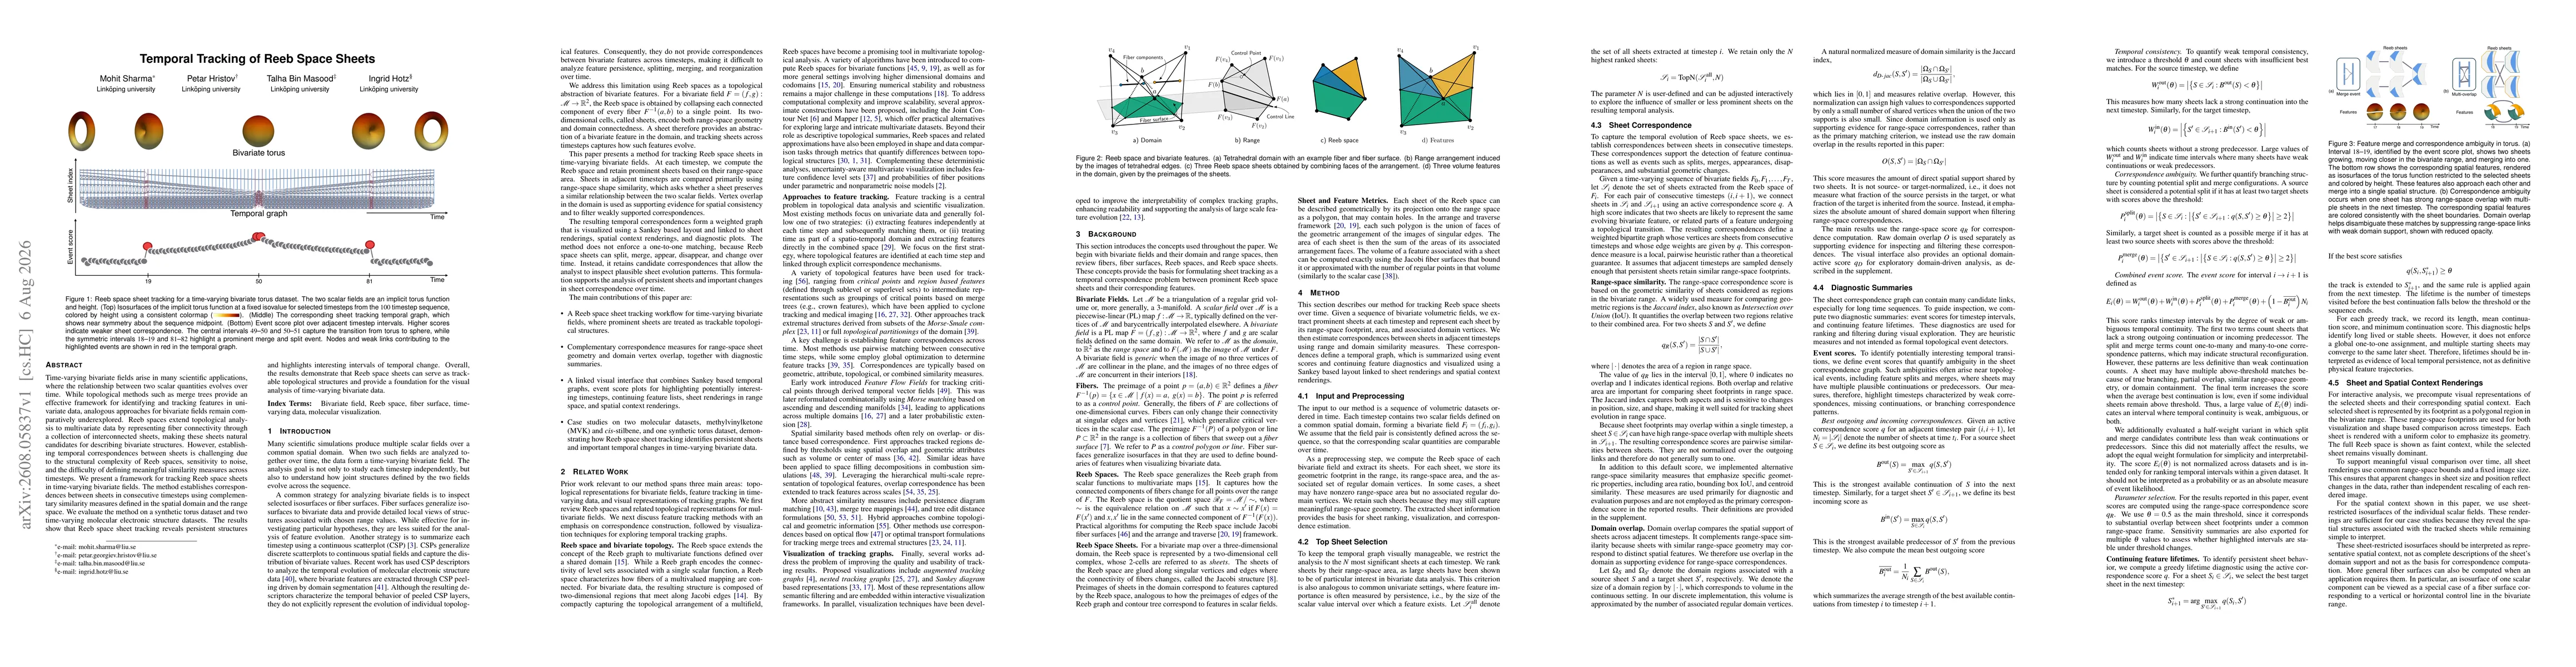
- Event scores and continuing feature lifetimes provide actionable measures to pinpoint potentially interesting transitions such as torus-to-sphere transitions and notable mergers/splits.
The work extends topological analysis to multivariate time-varying data by enabling explicit tracking of Reeb space sheets, offering a foundation for visual analysis of dynamic bivariate fields and potential insights into persistent and evolving structures in complex applications like molecular simulations.
A practical workflow for time-varying bivariate analysis via Reeb space sheet tracking, combining range-space geometry similarity with domain-vertex overlap evidence, and delivering a linked Sankey-based temporal graph plus diagnostic renderings.
Introduces the concept and implementation of tracking Reeb space sheets across time for multivariate fields, addressing the challenge of temporal correspondences in Reeb spaces and providing a visualization-augmented framework to study persistent and evolving bivariate structures.
- Matching is not forced to a strict one-to-one correspondence, which may require expert interpretation for ambiguous evolutions.
- Reliance on range-space shapes and vertex overlap may be sensitive to noise and require careful parameter tuning for robust correspondences.
- Computational costs grow with dataset size, particularly for large sheet counts and long time sequences, limiting real-time applicability.
- Develop automated criteria to prune unlikely correspondences and quantify confidence in sheet tracks.
- Explore more robust similarity measures and noise-robust Reeb space approximations to improve stability across timesteps.
- Scale the framework with optimized parallel implementations and advanced visualization techniques for very large time-varying multivariate datasets.
Discussion 0