ArxivLens

Quick Summary:

This study investigates temporal changes in high-degree solar acoustic modes using the GONG+ and MDI Dopplergrams, revealing increased amplitudes and decreased line-widths during the declining phase of solar cycle 23. The quiet Sun also shows similar solar cycle trends but with lesser magnitude, and GONG+ data indicates long-term variations beyond the solar cycle.

DOI: 10.1088/1742-6596/271/1/012012
arXiv Id: 1012.5128
Comments: 4 pages, 2 figures; Proceedings of the SOHO 24 / GONG 2010 conference, to be published in JPCS
Date Published: 2015-05-20
Date Updated: 2015-05-20

Categories:

Key Terms (TF-IDF):

amplitudes (0.316)
cycle (0.308)
solar (0.271)
sun (0.270)
widths (0.270)
trend (0.264)
variations (0.226)
previous studies (0.157)
long term (0.155)
acoustic (0.153)
phase (0.153)
decrease (0.144)
ring (0.144)
activity (0.140)
diagram (0.134)
applying (0.133)
seen (0.132)
temporal (0.129)
mode (0.123)
reduced (0.122)
License: http://arxiv.org/licenses/nonexclusive-distrib/1.0/

Summary:

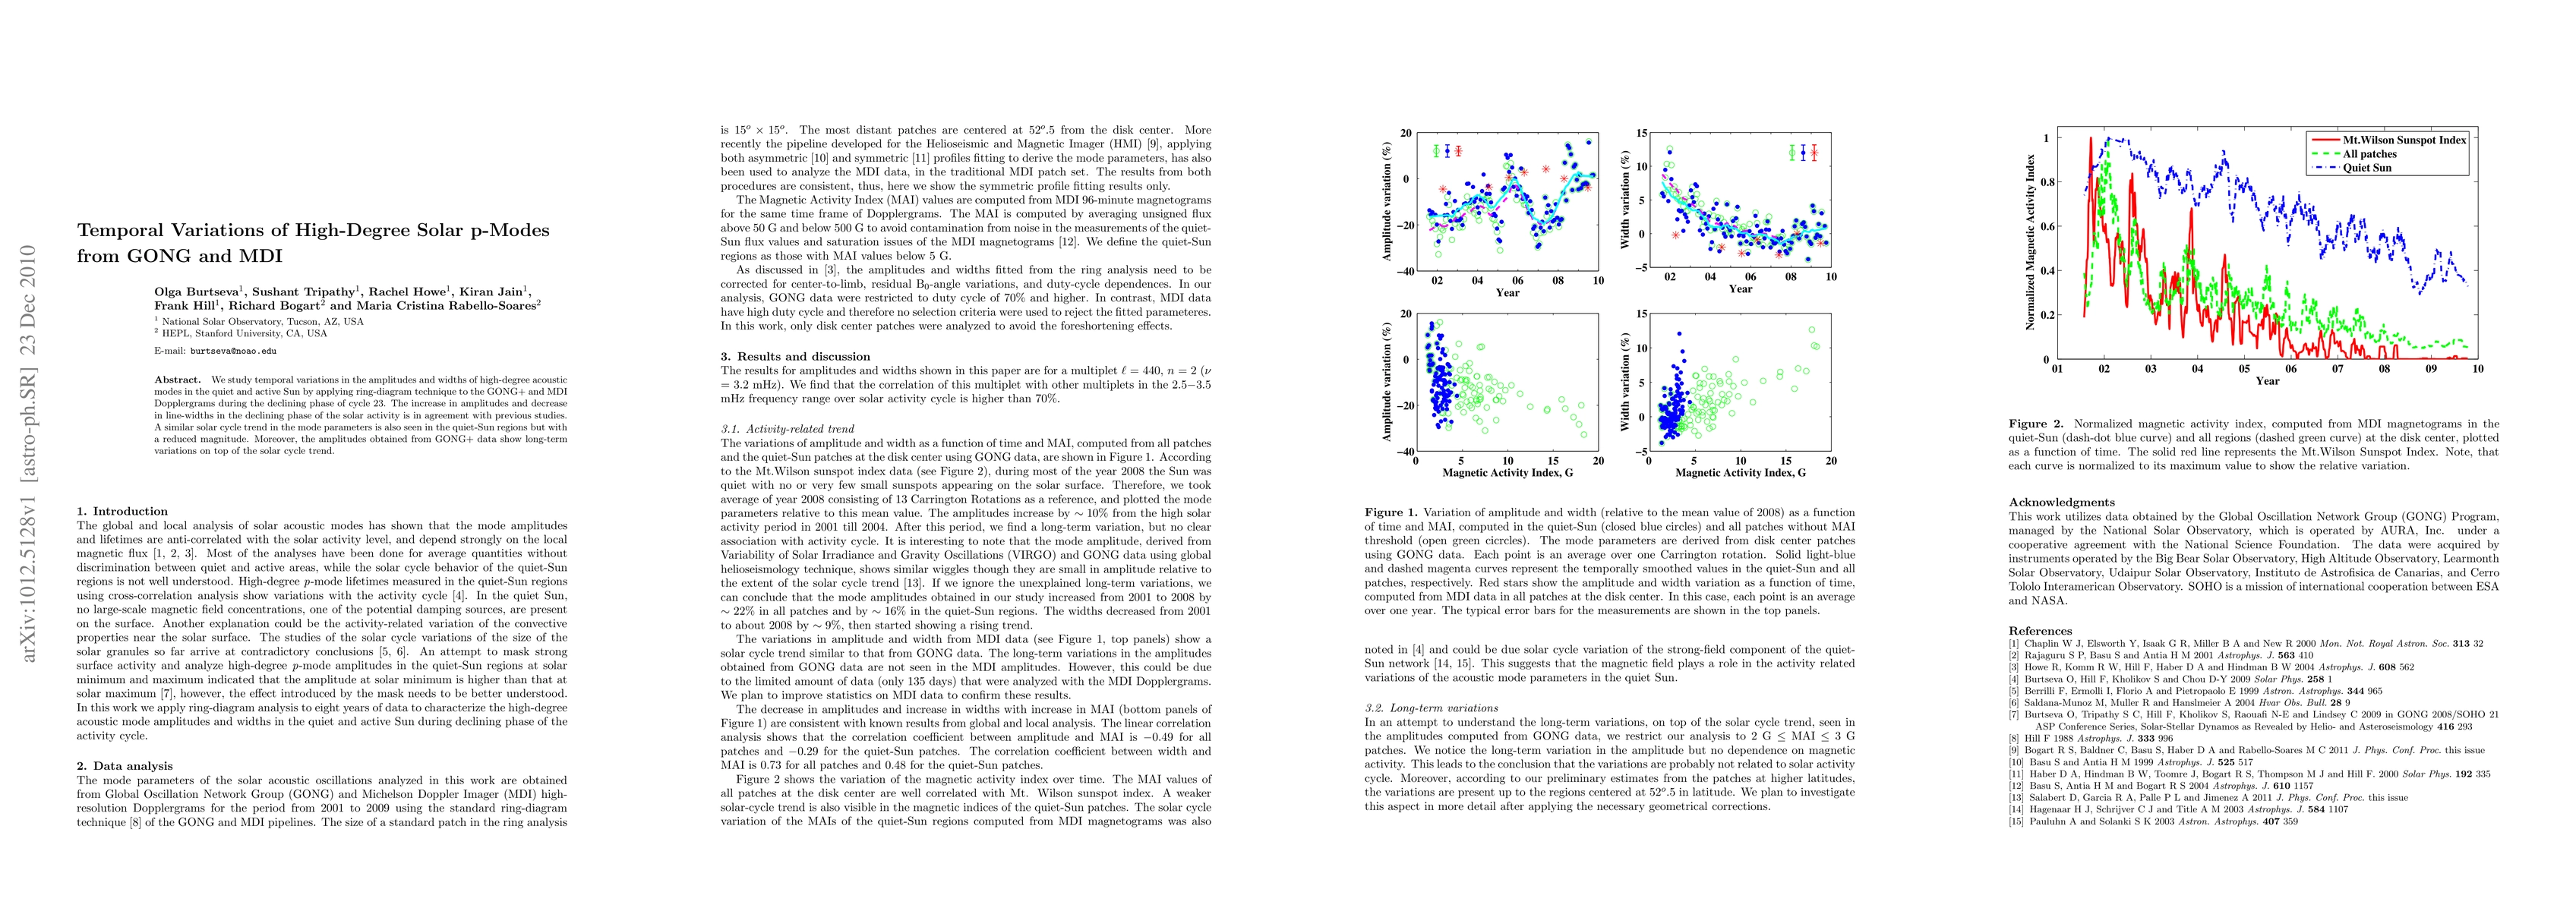
We study temporal variations in the amplitudes and widths of high-degree acoustic modes in the quiet and active Sun by applying ring-diagram technique to the GONG+ and MDI Dopplergrams during the declining phase of cycle 23. The increase in amplitudes and decrease in line-widths in the declining phase of the solar activity is in agreement with previous studies. A similar solar cycle trend in the mode parameters is also seen in the quiet-Sun regions but with a reduced magnitude. Moreover, the amplitudes obtained from GONG+ data show long-term variations on top of the solar cycle trend.

Citation & Reference Network Visualization

This graph shows how this paper is connected to other research. The current paper is shown in dark gray, papers that cite it are in green, and papers it references are in blue. You can:

Current Paper
Papers citing this work (Citations)
Papers cited by this work (References)

• Hover over any node to see the paper title

• Click a node to view that paper's details

• Drag nodes to rearrange the graph

• Use the zoom controls (bottom right) to zoom in/out

Citations and References

Title Authors Year Actions
Latest Results Found with Ring-Diagram Analysis
C. Baldner, S. Basu, R. Bogart, O. Burtseva, I. González Hernández, D. Haber, F. Hill, R. Howe, K. Jain, R. Komm, M. Rabello-Soares, S. Tripathy
2013
View Paper
Temporal Variations of High-Degree Solar p-Modes using Ring-Diagram Analysis
O. Burtseva, S. Tripathy, R. Bogart, K. Jain, R. Howe, F. Hill, M. Rabello-Soares
2013
View Paper
Latest Results Found with Ring-Diagram Analysis
C. Baldner, S. Basu, R. Bogart, O. Burtseva, I. González Hernández, D. Haber, F. Hill, R. Howe, K. Jain, R. Komm, M. Rabello-Soares, S. Tripathy
2012
View Paper

Comments (0)

This website uses cookies to ensure you get the best experience. Learn more