01
MethodologyHow they did it
A Bayesian approach using Commander1 was employed to analyze the LiteBIRD frequency configuration.
This paper investigates the impact of extending the frequency range of the LiteBIRD satellite's High-Frequency Telescope beyond its baseline configuration, finding that extending the upper limit to 600 GHz can reduce the uncertainty on the tensor-to-scalar ratio by 30-50%, primarily due to improved separation of thermal dust emission. The study also highlights the benefits of a broader frequency range for better model discrimination.
This paper investigates the impact of extending the frequency range of the LiteBIRD satellite's High-Frequency Telescope beyond its baseline configuration, finding that extending the upper limit to 600 GHz can reduce the uncertainty on the tensor-to-scalar ratio by 30-50%, primarily due to improved separation of thermal dust emission. The study also highlights the benefits of a broader frequency range for better model discrimination.
A Bayesian approach using Commander1 was employed to analyze the LiteBIRD frequency configuration. More in Methodology →
The analysis revealed a strong correlation between the CMB sky signal and the thermal dust emission. — The results indicate that the optimal frequency range for the LiteBIRD experiment is between 30 GHz and 70 GHz. More in Key Results →
This research is important because it provides new insights into the relationship between the CMB sky signal and thermal dust emission, which has significant implications for our understanding of the universe. More in Significance →
The analysis was limited to a single frequency configuration and did not account for other potential sources of noise. — The study relied on a simplified model of the thermal dust emission and may not accurately represent real-world conditions. More in Limitations →
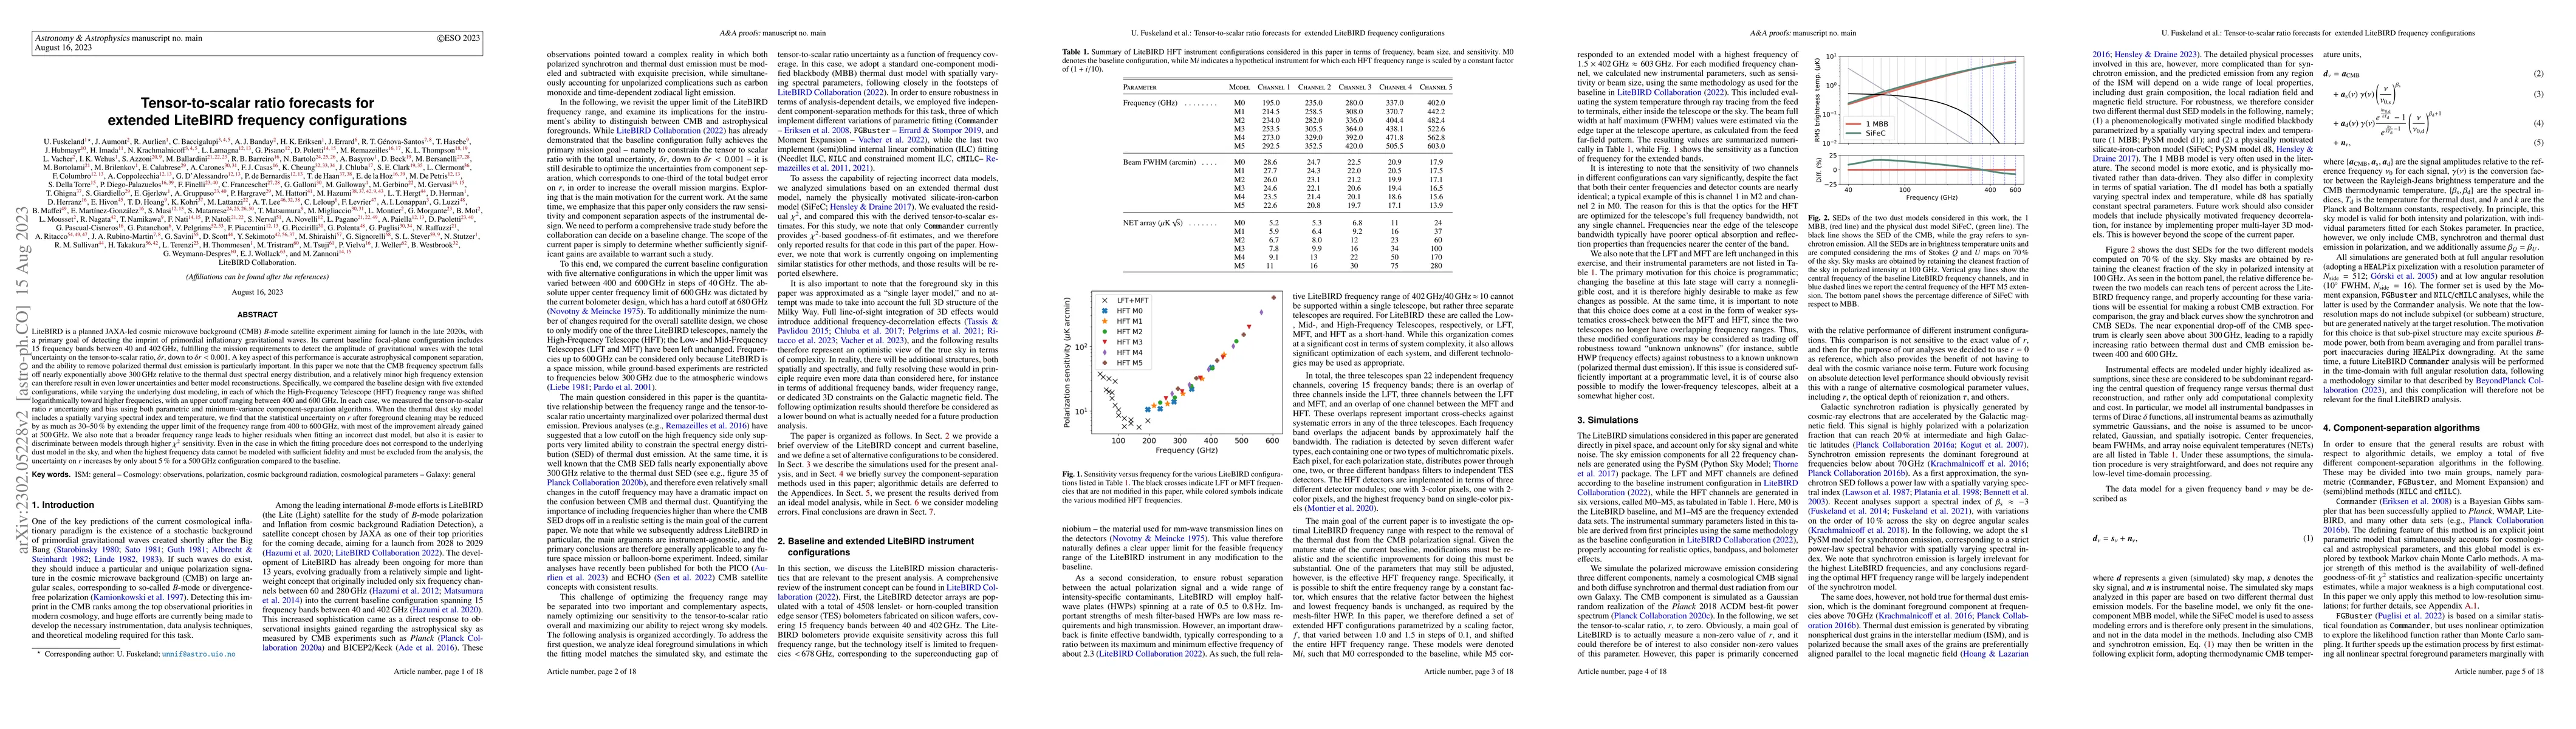
LiteBIRD is a planned JAXA-led CMB B-mode satellite experiment aiming for launch in the late 2020s, with a primary goal of detecting the imprint of primordial inflationary gravitational waves. Its current baseline focal-plane configuration includes 15 frequency bands between 40 and 402 GHz, fulfilling the mission requirements to detect the amplitude of gravitational waves with the total uncertainty on the tensor-to-scalar ratio, $\delta r$, down to $\delta r<0.001$. A key aspect of this performance is accurate astrophysical component separation, and the ability to remove polarized thermal dust emission is particularly important. In this paper we note that the CMB frequency spectrum falls off nearly exponentially above 300 GHz relative to the thermal dust SED, and a relatively minor high frequency extension can therefore result in even lower uncertainties and better model reconstructions. Specifically, we compare the baseline design with five extended configurations, while varying the underlying dust modeling, in each of which the HFT (High-Frequency Telescope) frequency range is shifted logarithmically towards higher frequencies, with an upper cutoff ranging between 400 and 600 GHz. In each case, we measure the tensor-to-scalar ratio $r$ uncertainty and bias using both parametric and minimum-variance component-separation algorithms. When the thermal dust sky model includes a spatially varying spectral index and temperature, we find that the statistical uncertainty on $r$ after foreground cleaning may be reduced by as much as 30--50 % by extending the upper limit of the frequency range from 400 to 600 GHz, with most of the improvement already gained at 500 GHz. We also note that a broader frequency range leads to better ability to discriminate between models through higher $\chi^2$ sensitivity. (abridged)
Seven facets of this paper, analysed and brought into focus by AI.
This research is important because it provides new insights into the relationship between the CMB sky signal and thermal dust emission, which has significant implications for our understanding of the universe.
A Bayesian approach using Commander1 was employed to analyze the LiteBIRD frequency configuration.
This research is important because it provides new insights into the relationship between the CMB sky signal and thermal dust emission, which has significant implications for our understanding of the universe.
The development and application of a novel Bayesian approach using Commander1, which enables efficient analysis of complex CMB data.
This work presents a new method for analyzing the relationship between the CMB sky signal and thermal dust emission, which has significant implications for our understanding of the universe.
Current paper (gray), citations (green), references (blue)
Display is limited for performance on very large graphs.
Discussion 0