Publication
Metrics
AI Quick Summary
This paper explores terahertz frequency-domain spectroscopy combined with multivariate analysis for inspecting pharmaceutical tablets, achieving high-quality models for tablet density and fair models for active pharmaceutical ingredient concentration, demonstrating the technique's potential for overcoming limitations of NIR and Raman spectroscopy.
Paper Preview
Abstract
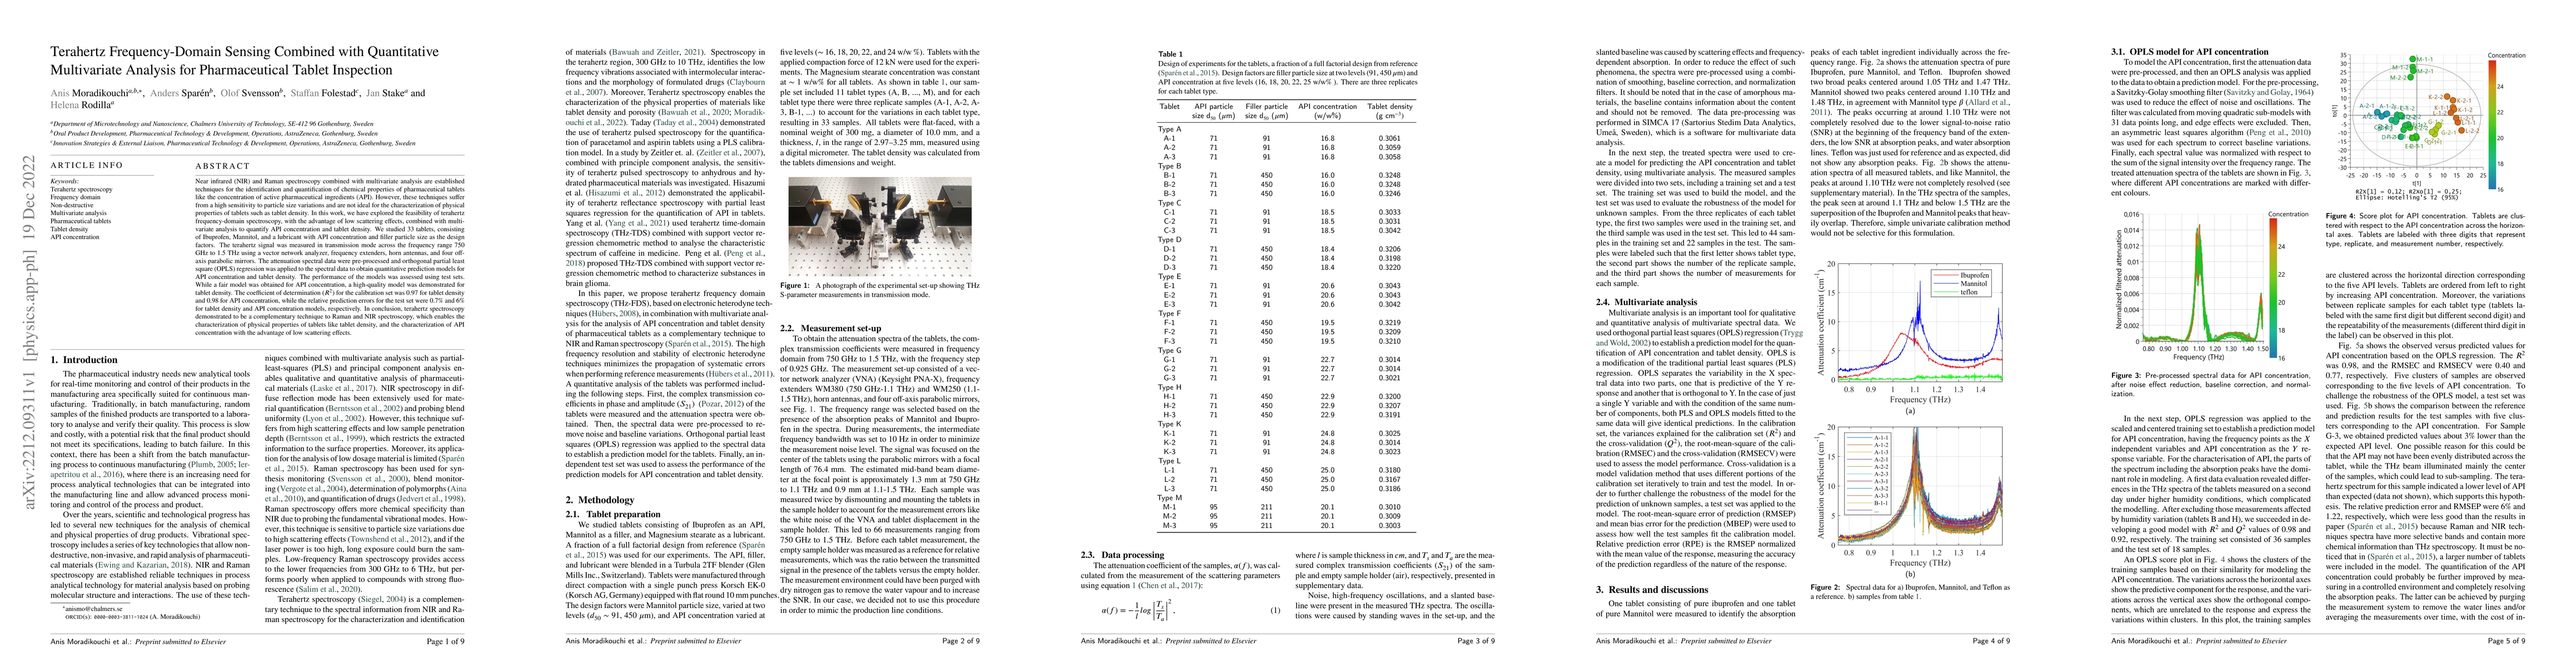
Near infrared (NIR) and Raman spectroscopy combined with multivariate analysis are established techniques for the identification and quantification of chemical properties of pharmaceutical tablets like the concentration of active pharmaceutical ingredients (API). However, these techniques suffer from a high sensitivity to particle size variations and are not ideal for the characterization of physical properties of tablets such as tablet density. In this work, we have explored the feasibility of terahertz frequency-domain spectroscopy, with the advantage of low scattering effects, combined with multivariate analysis to quantify API concentration and tablet density. We studied 33 tablets, consisting of Ibuprofen, Mannitol, and a lubricant with API concentration and filler particle size as the design factors. The terahertz signal was measured in transmission mode across the frequency range 750 GHz to 1.5 THz using a vector network analyzer, frequency extenders, horn antennas, and four off-axis parabolic mirrors. The attenuation spectral data were pre-processed and orthogonal partial least square (OPLS) regression was applied to the spectral data to obtain quantitative prediction models for API concentration and tablet density. The performance of the models was assessed using test sets. While a fair model was obtained for API concentration, a high-quality model was demonstrated for tablet density. The coefficient of determination for the calibration set was 0.97 for tablet density and 0.98 for API concentration, while the relative prediction errors for the test set were 0.7% and 6%for tablet density and API concentration models, respectively.
AI Key Findings
Get AI-generated insights about this paper's methodology, results, significance, and more — seven facets brought into focus.
Impact
Paper Details
Authors
PDF Preview
Key Terms
Citation Network
Current paper (gray), citations (green), references (blue)
Display is limited for performance on very large graphs.
Discussion 0