Publication
Metrics
Paper Preview
Abstract
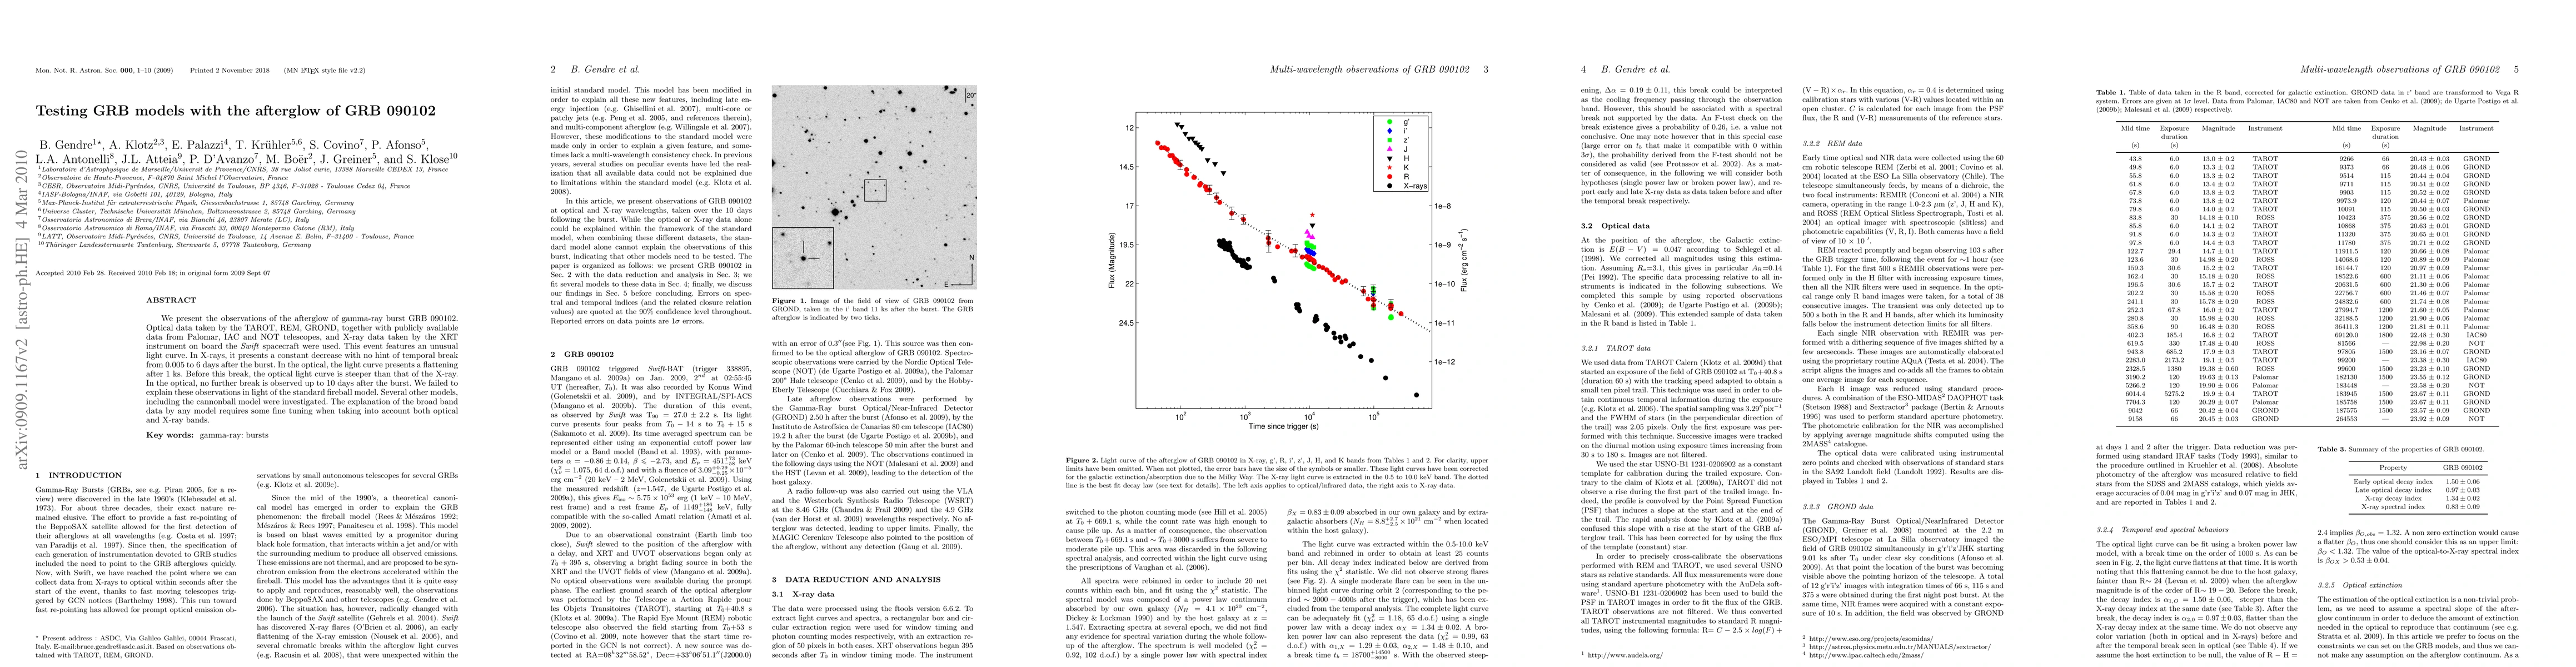
We present the observations of the afterglow of gamma-ray burst GRB 090102. Optical data taken by the TAROT, REM, GROND, together with publicly available data from Palomar, IAC and NOT telescopes, and X-ray data taken by the XRT instrument on board the Swift spacecraft were used. This event features an unusual light curve. In X-rays, it presents a constant decrease with no hint of temporal break from 0.005 to 6 days after the burst. In the optical, the light curve presents a flattening after 1 ks. Before this break, the optical light curve is steeper than that of the X-ray. In the optical, no further break is observed up to 10 days after the burst. We failed to explain these observations in light of the standard fireball model. Several other models, including the cannonball model were investigated. The explanation of the broad band data by any model requires some fine tuning when taking into account both optical and X-ray bands.
AI Key Findings
Get AI-generated insights about this paper's methodology, results, significance, and more — seven facets brought into focus.
Impact
Paper Details
PDF Preview
Key Terms
Citation Network
Current paper (gray), citations (green), references (blue)
Display is limited for performance on very large graphs.
Discussion 0