Testing Hypotheses in Particle Physics: Plots of $p_{0}$ Versus $p_{1}$
Publication
Metrics
Paper Preview
Abstract
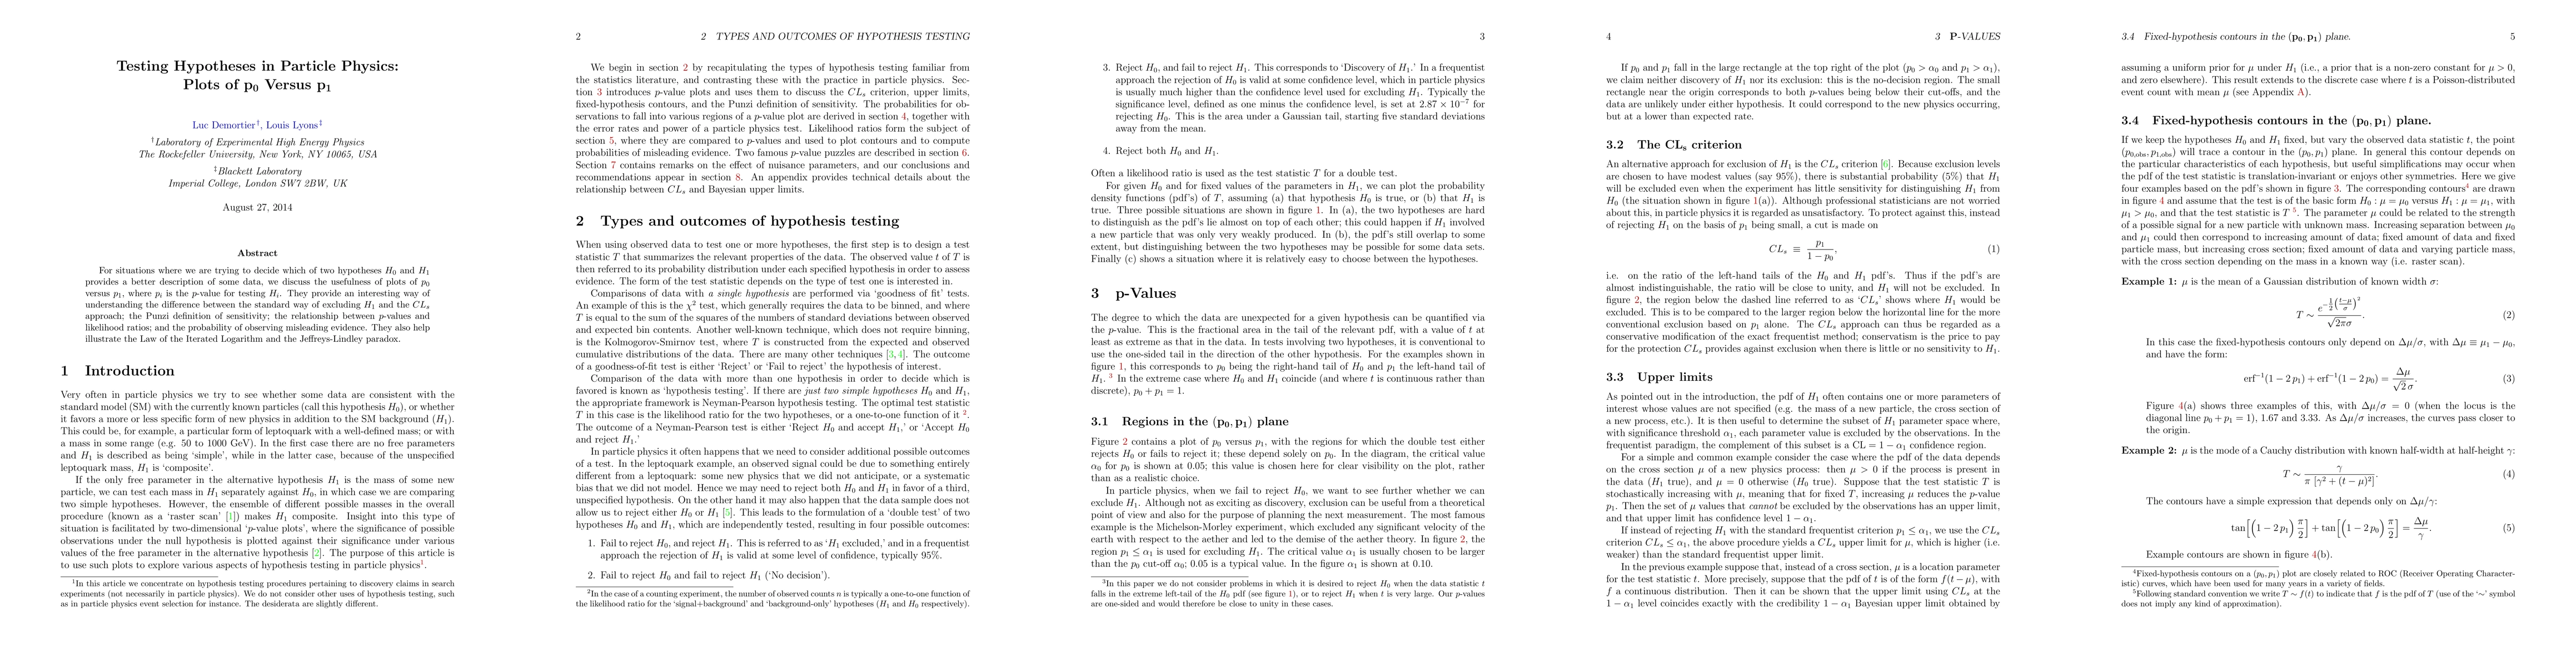
For situations where we are trying to decide which of two hypotheses $H_{0}$ and $H_{1}$ provides a better description of some data, we discuss the usefulness of plots of $p_{0}$ versus $p_{1}$, where $p_{i}$ is the $p$-value for testing $H_{i}$. They provide an interesting way of understanding the difference between the standard way of excluding $H_{1}$ and the $CL_{s}$ approach; the Punzi definition of sensitivity; the relationship between $p$-values and likelihood ratios; and the probability of observing misleading evidence. They also help illustrate the Law of the Iterated Logarithm and the Jeffreys-Lindley paradox.
AI Key Findings
Get AI-generated insights about this paper's methodology, results, significance, and more — seven facets brought into focus.
Impact
Paper Details
PDF Preview
Key Terms
Citation Network
Current paper (gray), citations (green), references (blue)
Display is limited for performance on very large graphs.
Discussion 0