Publication
Metrics
AI Quick Summary
This paper tests two relativistic accretion disk models, KERRBB and KYNBB, using RXTE data from GRO J1655-40. Both models yielded identical results when the inner disk edge was set at the innermost stable circular orbit, but variable black hole spin values improved fit statistics significantly.
Paper Preview
Abstract
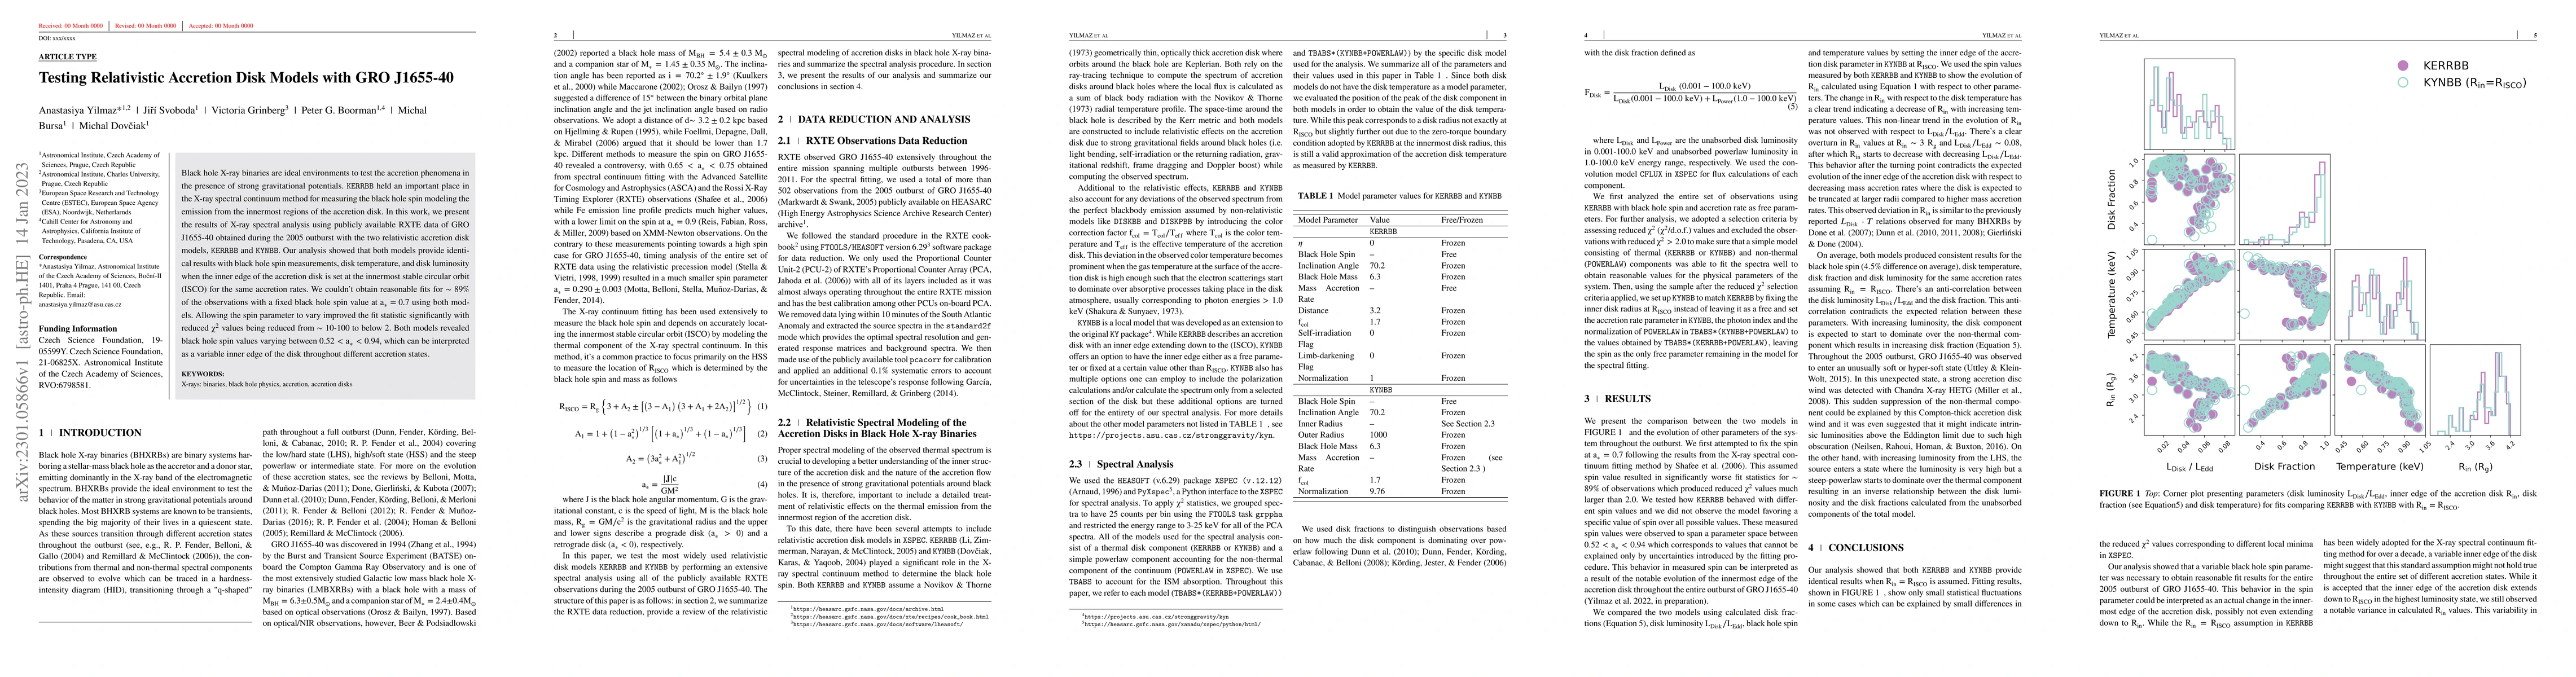
Black hole X-ray binaries are ideal environments to test the accretion phenomena in the presence of strong gravitational potentials. KERRBB held an important place in the X-ray spectral continuum method for measuring the black hole spin modeling the emission from the innermost regions of the accretion disk. In this work, we present the results of X-ray spectral analysis using publicly available RXTE data of GRO J1655-40 obtained during the 2005 outburst with the two relativistic accretion disk models, KERRBB and KYNBB. Our analysis showed that both models provide identical results with black hole spin measurements, disk temperature, and disk luminosity when the inner edge of the accretion disk is set at the innermost stable circular orbit (ISCO) for the same accretion rates. We couldn't obtain reasonable fits for $\sim$ 89\% of the observations with a fixed black hole spin value at $\mathrm{a_{*}=0.7}$ using both models. Allowing the spin parameter to vary improved the fit statistic significantly with reduced $\rm \chi^{2}$ values being reduced from $\sim$ 10-100 to below 2. Both models revealed black hole spin values varying between $\rm 0.52
AI Key Findings
Get AI-generated insights about this paper's methodology, results, significance, and more — seven facets brought into focus.
Impact
Paper Details
Authors
PDF Preview
Key Terms
Citation Network
Current paper (gray), citations (green), references (blue)
Display is limited for performance on very large graphs.
Discussion 0