Testing the Regular Variation Model for Multivariate Extremes with Flexible Circular and Spherical Distributions
Publication
Metrics
AI Quick Summary
This paper proposes flexible circular and spherical distributions based on nonnegative trigonometric sums to model the angular measure in the regular variation model for multivariate extremes, enabling statistical tests for inferring dependence structures among extreme values. The methodology is applied to financial datasets to validate the approach.
Paper Preview
Abstract
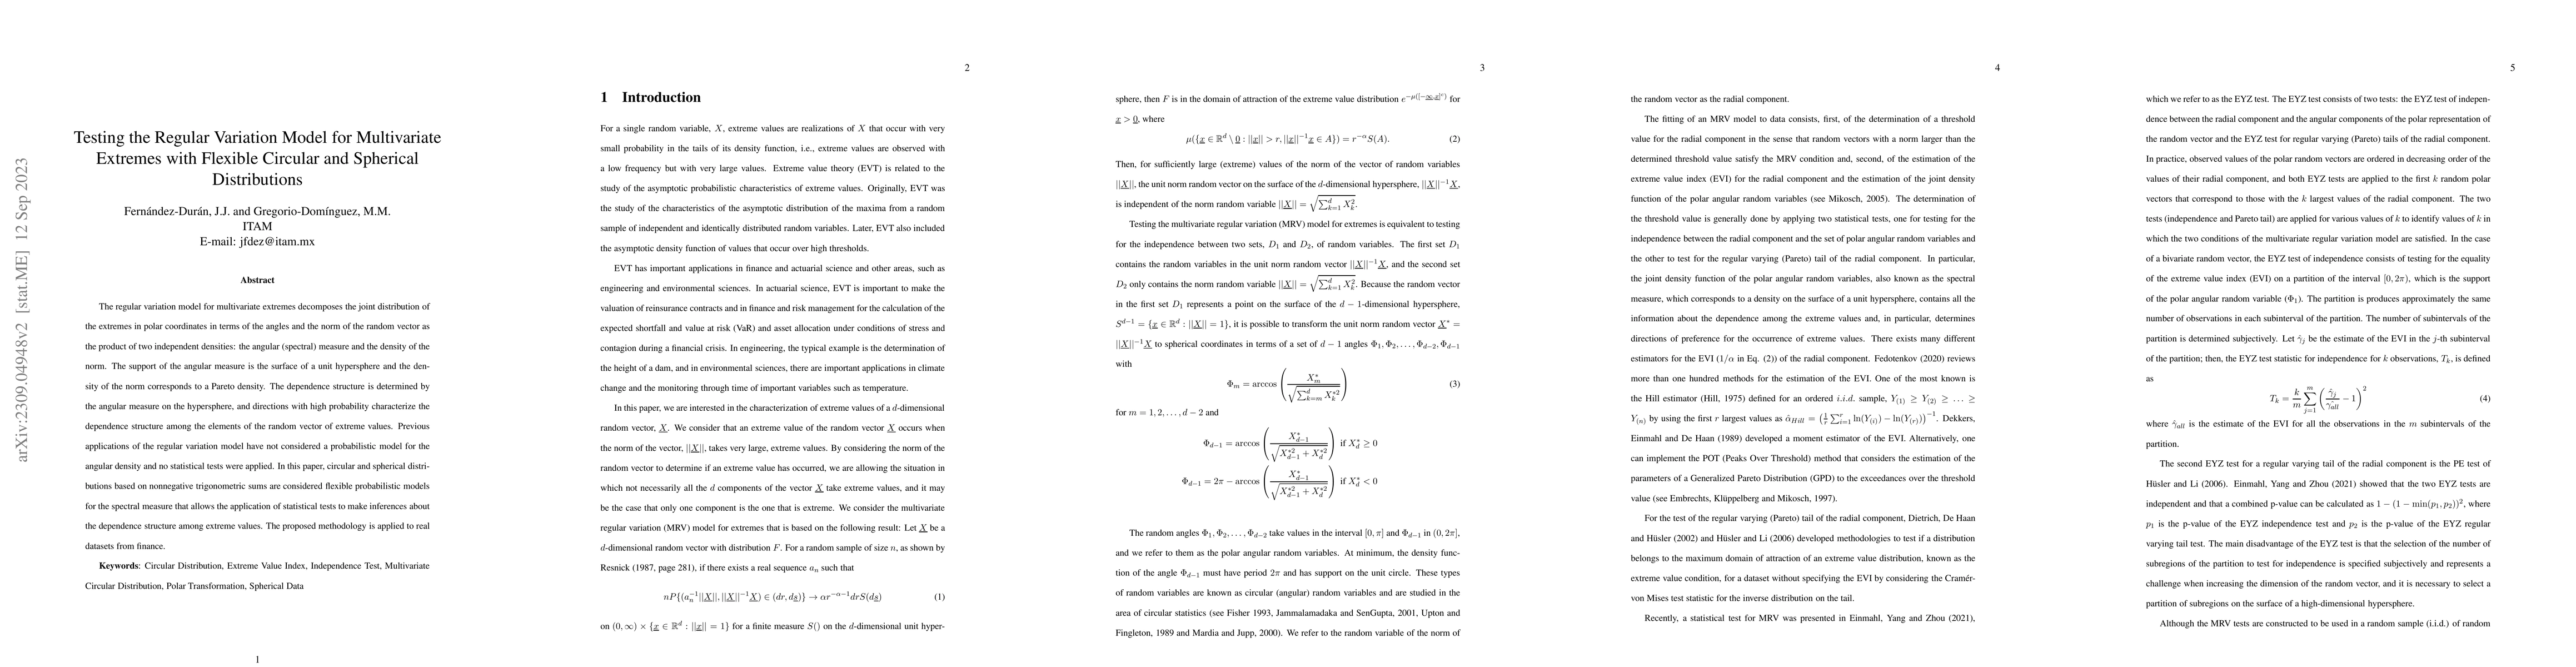
The regular variation model for multivariate extremes decomposes the joint distribution of the extremes in polar coordinates in terms of the angles and the norm of the random vector as the product of two independent densities: the angular (spectral) measure and the density of the norm. The support of the angular measure is the surface of a unit hypersphere and the density of the norm corresponds to a Pareto density. The dependence structure is determined by the angular measure on the hypersphere, and directions with high probability characterize the dependence structure among the elements of the random vector of extreme values. Previous applications of the regular variation model have not considered a probabilistic model for the angular density and no statistical tests were applied. In this paper, circular and spherical distributions based on nonnegative trigonometric sums are considered flexible probabilistic models for the spectral measure that allows the application of statistical tests to make inferences about the dependence structure among extreme values. The proposed methodology is applied to real datasets from finance.
AI Key Findings
Get AI-generated insights about this paper's methodology, results, significance, and more — seven facets brought into focus.
Impact
Paper Details
Authors
PDF Preview
Key Terms
Citation Network
Current paper (gray), citations (green), references (blue)
Display is limited for performance on very large graphs.
Discussion 0