Tests for ultrahigh-dimensional partially linear regression models
Publication
Metrics
AI Quick Summary
This paper develops tests for ultrahigh-dimensional partially linear regression models, employing machine learning to estimate unknown nuisance functions and introducing quadratic-form test statistics. It establishes the asymptotic normality of these tests and proposes a power-enhanced procedure with two thresholding methods for improved performance, demonstrating strong empirical results.
Paper Preview
Abstract
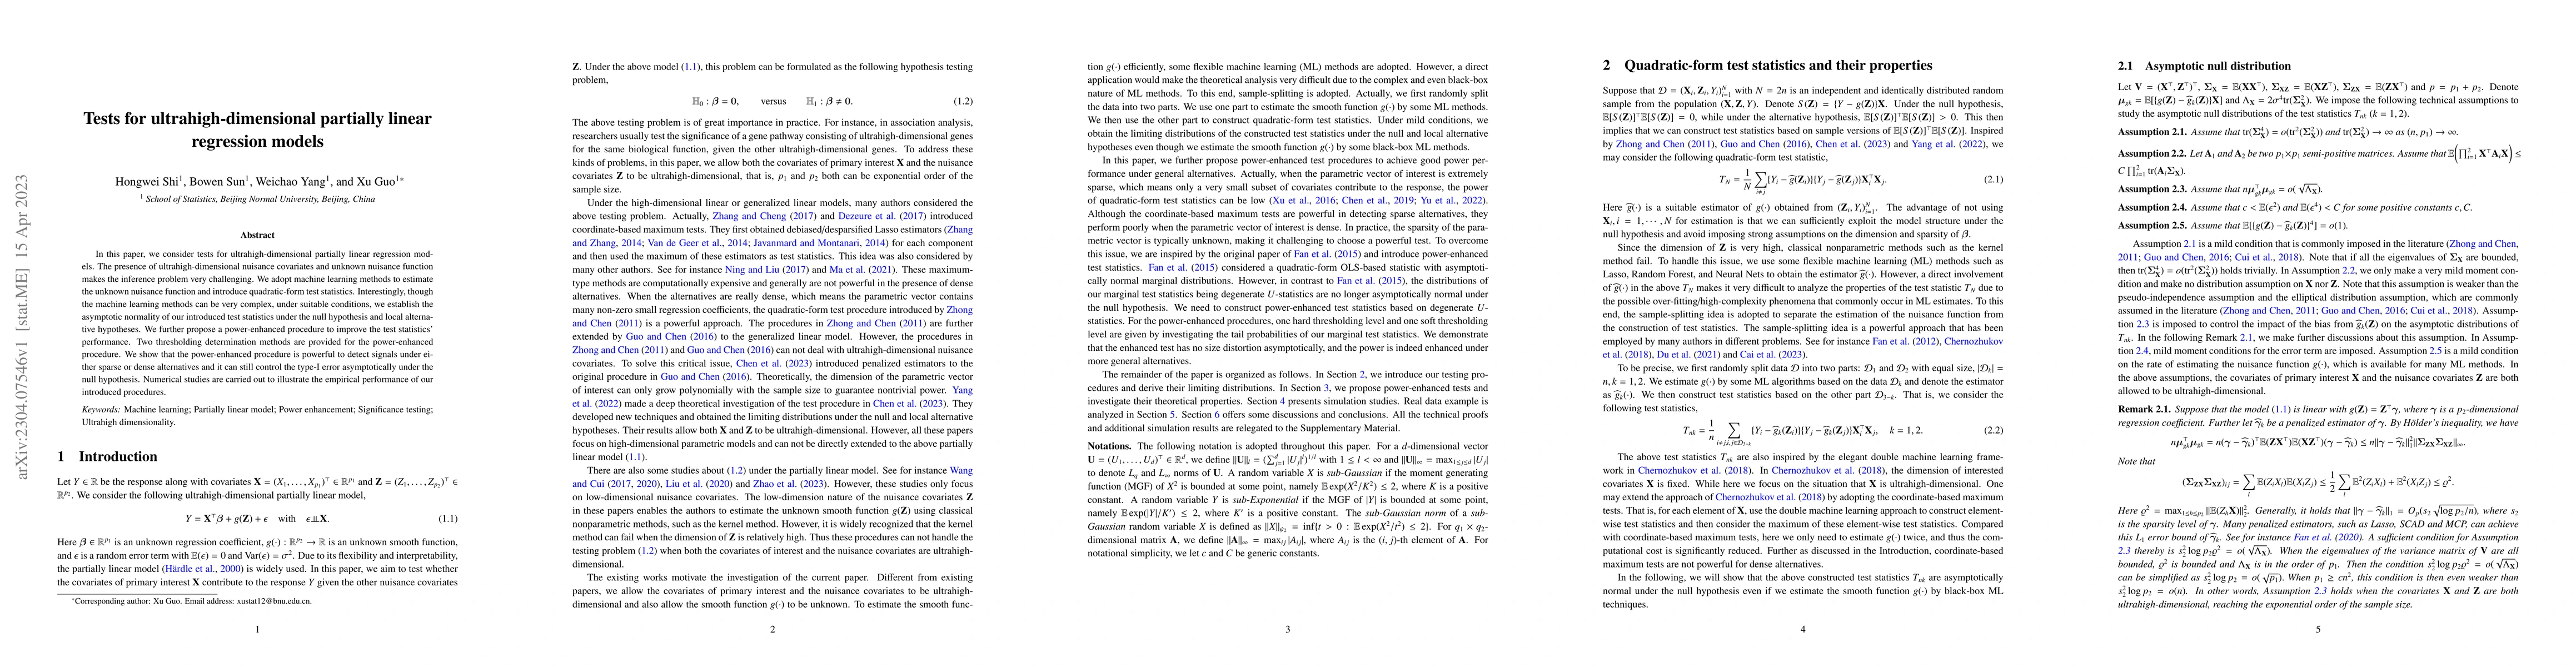
In this paper, we consider tests for ultrahigh-dimensional partially linear regression models. The presence of ultrahigh-dimensional nuisance covariates and unknown nuisance function makes the inference problem very challenging. We adopt machine learning methods to estimate the unknown nuisance function and introduce quadratic-form test statistics. Interestingly, though the machine learning methods can be very complex, under suitable conditions, we establish the asymptotic normality of our introduced test statistics under the null hypothesis and local alternative hypotheses. We further propose a power-enhanced procedure to improve the test statistics' performance. Two thresholding determination methods are provided for the power-enhanced procedure. We show that the power-enhanced procedure is powerful to detect signals under either sparse or dense alternatives and it can still control the type-I error asymptotically under the null hypothesis. Numerical studies are carried out to illustrate the empirical performance of our introduced procedures.
AI Key Findings
Get AI-generated insights about this paper's methodology, results, significance, and more — seven facets brought into focus.
Impact
Paper Details
Authors
PDF Preview
Key Terms
Citation Network
Current paper (gray), citations (green), references (blue)
Display is limited for performance on very large graphs.
Discussion 0