TEVISE: An Interactive Visual Analytics Tool to Explore Evolution of Keywords' Relations in Tweet Data
Publication
Metrics
AI Quick Summary
This research paper presents TEVisE, an interactive visual analytics tool to explore tweet data's evolution of keywords' relations over time, improving upon existing tools like TExVis with enhanced visualization features.
Paper Preview
Abstract
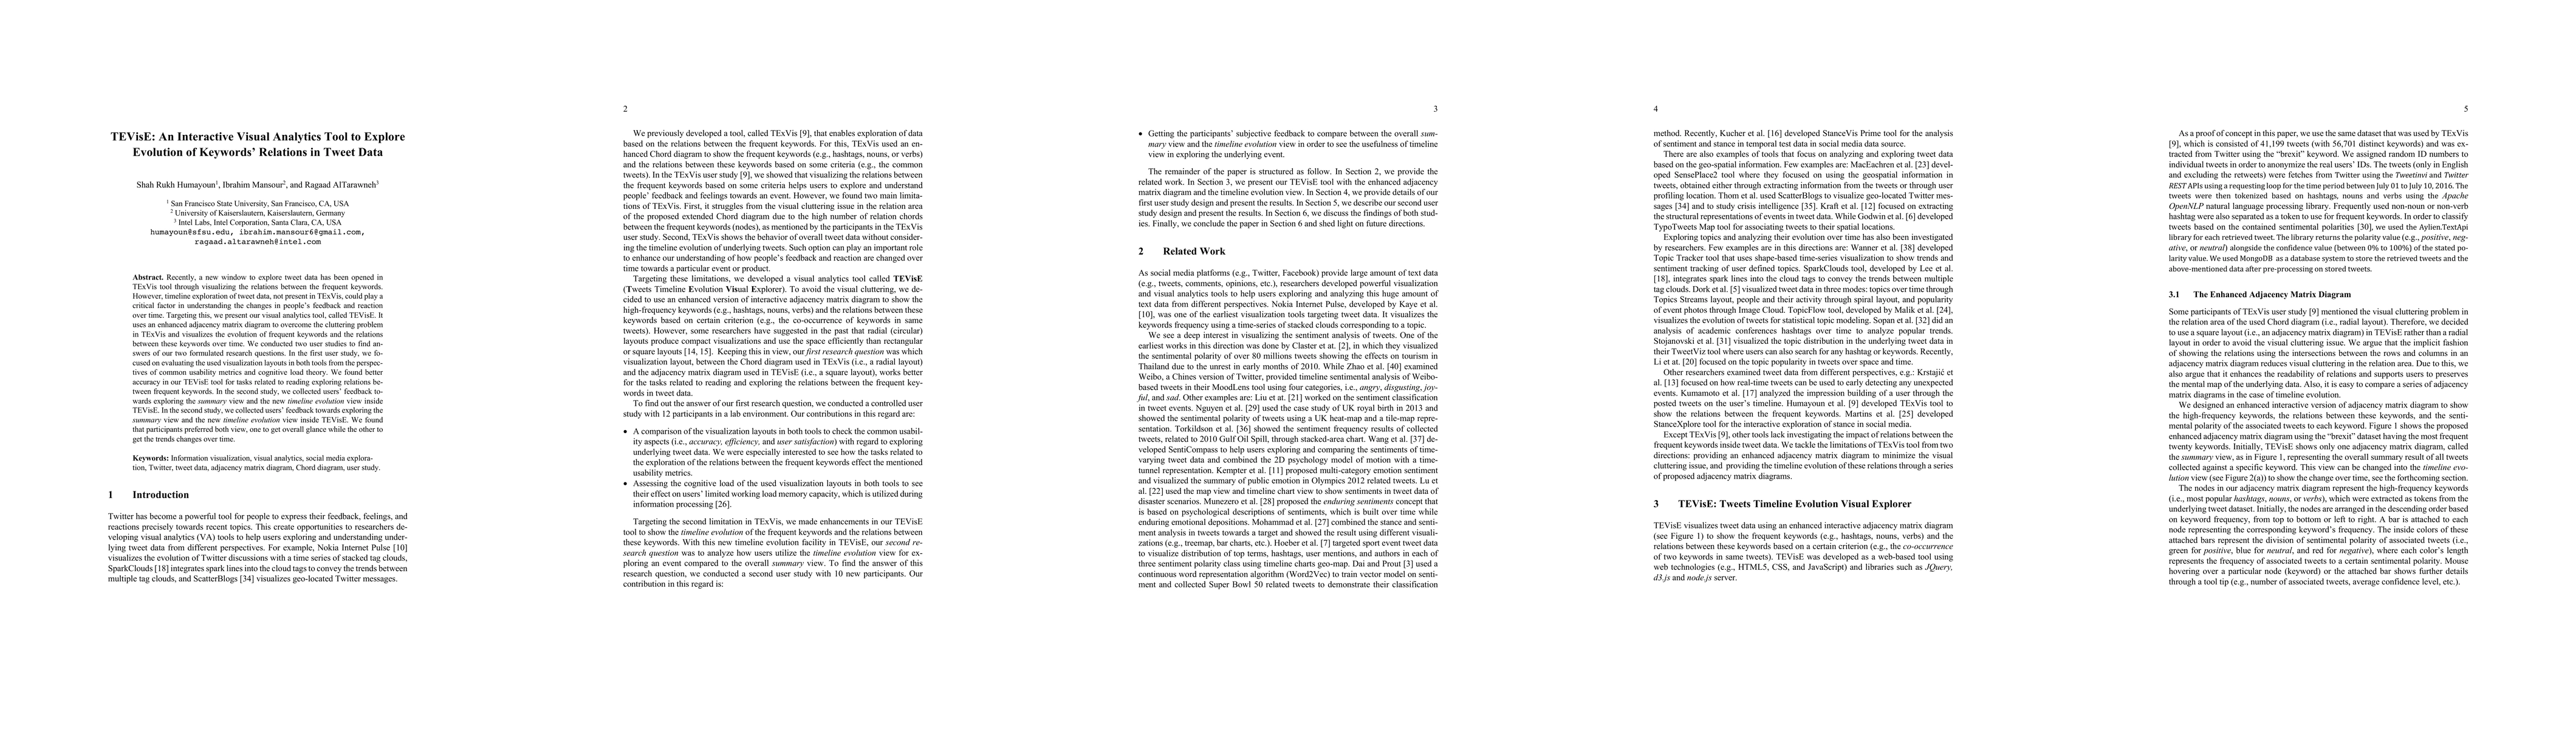
Recently, a new window to explore tweet data has been opened in TExVis tool through visualizing the relations between the frequent keywords. However, timeline exploration of tweet data, not present in TExVis, could play a critical factor in understanding the changes in people's feedback and reaction over time. Targeting this, we present our visual analytics tool, called TEVisE. It uses an enhanced adjacency matrix diagram to overcome the cluttering problem in TExVis and visualizes the evolution of frequent keywords and the relations between these keywords over time. We conducted two user studies to find answers of our two formulated research questions. In the first user study, we focused on evaluating the used visualization layouts in both tools from the perspectives of common usability metrics and cognitive load theory. We found better accuracy in our TEVisE tool for tasks related to reading exploring relations between frequent keywords. In the second study, we collected users' feedback towards exploring the summary view and the new timeline evolution view inside TEVisE. In the second study, we collected users' feedback towards exploring the summary view and the new timeline evolution view inside TEVisE. We found that participants preferred both view, one to get overall glance while the other to get the trends changes over time.
AI Key Findings
Get AI-generated insights about this paper's methodology, results, significance, and more — seven facets brought into focus.
Impact
Paper Details
Authors
PDF Preview
Key Terms
Citation Network
Current paper (gray), citations (green), references (blue)
Display is limited for performance on very large graphs.
Discussion 0