ArxivLens

Quick Summary:

This paper proposes an automatic system for generating infographics from proportion-related natural language statements, aiming to simplify the creation process for casual users. The system demonstrates its effectiveness through a proof-of-concept and expert reviews.

arXiv Id: 1907.09091
Comments: InfoVis 2019
Date Published: 2019-07-23
Date Updated: 2019-07-23

Categories:

Key Terms (TF-IDF):

expertise (0.287)
tools (0.285)
statements (0.277)
tools (0.271)
preliminary (0.239)
preliminary (0.228)
automatically (0.219)
automatically (0.217)
design (0.201)
design (0.193)
explore (0.183)
explore (0.182)
messages (0.162)
reviews (0.159)
reviews (0.159)
usefulness (0.157)
expert (0.157)
expert (0.156)
messages (0.156)
proportion (0.156)
License: http://arxiv.org/licenses/nonexclusive-distrib/1.0/

Summary:

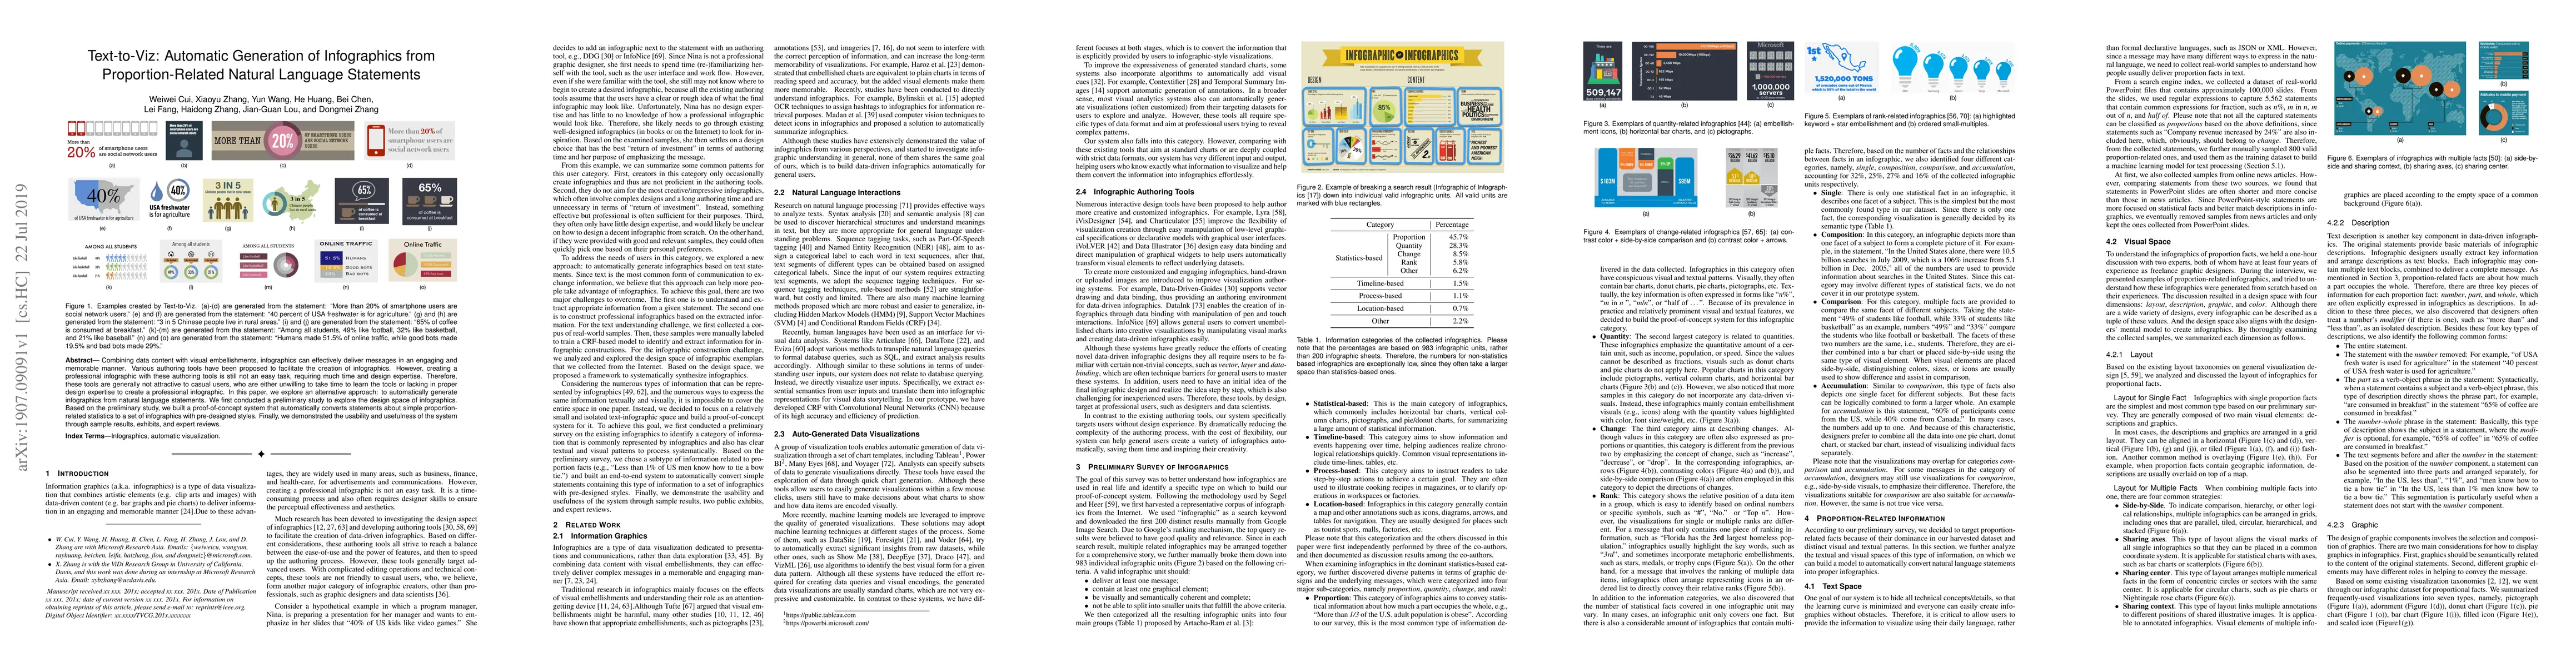
Combining data content with visual embellishments, infographics can effectively deliver messages in an engaging and memorable manner. Various authoring tools have been proposed to facilitate the creation of infographics. However, creating a professional infographic with these authoring tools is still not an easy task, requiring much time and design expertise. Therefore, these tools are generally not attractive to casual users, who are either unwilling to take time to learn the tools or lacking in proper design expertise to create a professional infographic. In this paper, we explore an alternative approach: to automatically generate infographics from natural language statements. We first conducted a preliminary study to explore the design space of infographics. Based on the preliminary study, we built a proof-of-concept system that automatically converts statements about simple proportion-related statistics to a set of infographics with pre-designed styles. Finally, we demonstrated the usability and usefulness of the system through sample results, exhibits, and expert reviews.

Citation & Reference Network Visualization

This graph shows how this paper is connected to other research. The current paper is shown in dark gray, papers that cite it are in green, and papers it references are in blue. You can:

Current Paper
Papers citing this work (Citations)
Papers cited by this work (References)

• Hover over any node to see the paper title

• Click a node to view that paper's details

• Drag nodes to rearrange the graph

• Use the zoom controls (bottom right) to zoom in/out

Citations and References

Title Authors Year Actions
FlowLLM: Large language model driven flow visualization
Zilin Li, Weihan Zhang, Jun Tao
2025
View Paper
Reflection on Data Storytelling Tools in the Generative AI Era from the Human-AI Collaboration Perspective
Haotian Li, Yun Wang, Huamin Qu
2025
View Paper
VisualFusion: Enhancing Blog Content with Advanced Infographic Pipeline
Anurag Deo, Savita Bhat, S. Karande
2025
View Paper
FactFlow: Automatic Fact Sheet Generation and Customization from Tabular Dataset via AI Chain Design&Implementation
Minh Duc Vu, Jieshan Chen, Zhenchang Xing, Qinghua Lu, Xiwei Xu, Qian Fu
2025
View Paper
VisPath: Automated Visualization Code Synthesis via Multi-Path Reasoning and Feedback-Driven Optimization
Wonduk Seo, Seungyong Lee, Daye Kang, Zonghao Yuan, Seunghyun Lee
2025
View Paper
GistVis: Automatic Generation of Word-scale Visualizations from Data-rich Documents
Ruishi Zou, Yinqi Tang, Jingzhu Chen, Siyu Lu, Yan Lu, Yingfan Yang, Chen Ye
2025
View Paper
Explainable XR: Understanding User Behaviors of XR Environments Using LLM-Assisted Analytics Framework
Yoonsang Kim, Zainab Aamir, Mithilesh Singh, S. Boorboor, Klaus Mueller, Arie E. Kaufman
2025
View Paper
Grounding with Structure: Exploring Design Variations of Grounded Human-AI Collaboration in a Natural Language Interface
Hyo Jin Do, Michelle Brachman, Casey Dugan, James M. Johnson, Julia Lauer, Priyanshu Rai, Qian Pan
2024
View Paper
ChartifyText: Automated Chart Generation from Data-Involved Texts via LLM
Songheng Zhang, Lei Wang, Toby Jia-Jun Li, Qiaomu Shen, Yixin Cao, Yong Wang
2024
View Paper
VisAnatomy: An SVG Chart Corpus with Fine-Grained Semantic Labels
Chen Chen, Hannah K. Bako, Peihong Yu, John Hooker, Jeffrey Joyal, Simon C. Wang, Samuel Kim, Jessica Wu, Aoxue Ding, Lara Sandeep, Alex Chen, Chayanika Sinha, Zhicheng Liu
2024
View Paper
Mindalogue: LLM-Powered Nonlinear Interaction for Effective Learning and Task Exploration
Rui Zhang, Ziyao Zhang, Fengliang Zhu, Jiajie Zhou, Anyi Rao
2024
View Paper
ChatGrid: Power Grid Visualization Empowered by a Large Language Model
Sichen Jin, Shrirang Abhyankar
2024
View Paper
Mind Your Questions! Towards Backdoor Attacks on Text-to-Visualization Models
Shuaimin Li, Yuanfeng Song, Xuanang Chen, Anni Peng, Zhuoyue Wan, C. Zhang, Raymond Chi-Wing Wong
2024
View Paper
Narrative Player: Reviving Data Narratives with Visuals
Zekai Shao, Leixian Shen, Haotian Li, Yi Shan, Huamin Qu, Yun Wang, Siming Chen
2024
View Paper
Data Playwright: Authoring Data Videos with Annotated Narration
Leixian Shen, Haotian Li, Yun Wang, Tianqi Luo, Yuyu Luo, Huamin Qu
2024
View Paper
Natural Language Generation for Visualizations: State of the Art, Challenges and Future Directions
Enamul Hoque, Mohammed Saidul Islam
2024
View Paper
MapCraft: Dissecting and Designing Custom Geo-Infographics
Xinyuan Zhang, Yifan Xu, Kaiwen Li, Lingyun Yu, Yu Liu
2024
View Paper
Unveiling How Examples Shape Visualization Design Outcomes
Hannah K. Bako, Xinyi Liu, Grace Ko, Hyemi Song, Leilani Battle, Zhicheng Liu
2024
View Paper
Adversarial Attacks on Machine Learning-Aided Visualizations
Takanori Fujiwara, Kostiantyn Kucher, Junpeng Wang, Rafael M. Martins, A. Kerren, A. Ynnerman
2024
View Paper
ChatKG: Visualizing time-series patterns aided by intelligent agents and a knowledge graph
L. Christino, F. Paulovich
2024
View Paper
Educational Games based on the Contextual Teaching Learning (CTL) Approach: Increasing Motivation & Critical Thinking for Students in Riau Province
Adisti Yuliastrin, Rian Vebrianto, Musa Thahir, Mery Berlian, Niki Dian Permana
2024
View Paper
Datasets of Visualization for Machine Learning
Can Liu, Ruike Jiang, Shaocong Tan, Jiacheng Yu, Chaofan Yang, Hanning Shao, Xiaoru Yuan
2024
View Paper
AVA: An automated and AI-driven intelligent visual analytics framework
Jiazhe Wang, Xi Li, Chenlu Li, Di Peng, Arran Zeyu Wang, Yuhui Gu, Xingui Lai, Haifeng Zhang, Xinyue Xu, Xiaoqing Dong, Zhifeng Lin, Jiehui Zhou, Xingyu Liu, Wei Chen
2024
View Paper
Generative AI for Visualization: State of the Art and Future Directions
Yilin Ye, Jianing Hao, Yihan Hou, Zhan Wang, Shishi Xiao, Yuyu Luo, Wei Zeng
2024
View Paper
Epigraphics: Message-Driven Infographics Authoring
Tongyu Zhou, Jeff Huang, G. Chan
2024
View Paper
Towards Robustness of Text-to-Visualization Translation against Lexical and Phrasal Variability
Jinwei Lu, Yuanfeng Song, Haodi Zhang, Chen Zhang, Raymond Chi-Wing Wong
2024
View Paper
Chart What I Say: Exploring Cross-Modality Prompt Alignment in AI-Assisted Chart Authoring
Nazar Ponochevnyi, Anastasia Kuzminykh
2024
View Paper
A bibliometric exploration of infographics as tools for visual literacy in education
Paula Marcelle, Okan Arslan, A. Balogun, Monalisa Dash
2024
View Paper
Visual harmony: text-visual interplay in circular infographics
Shuqi He, Yuqing Chen, Yuxin Xia, Yichun Li, Hai-Ning Liang, Lingyun Yu
2024
View Paper
Prompt4Vis: Prompting Large Language Models with Example Mining and Schema Filtering for Tabular Data Visualization
Shuaimin Li, Xuanang Chen, Yuanfeng Song, Yunze Song, C. Zhang
2024
View Paper
GraphiMind: LLM-centric Interface for Information Graphics Design
Qiruin Huang, Min Lu, J. Lanir, D. Lischinski, D. Cohen-Or, Hui Huang
2024
View Paper
TypeDance: Creating Semantic Typographic Logos from Image through Personalized Generation
Shishi Xiao, Liangwei Wang, Xiaojuan Ma, Wei Zeng
2024
View Paper
Socrates: Data Story Generation via Adaptive Machine-Guided Elicitation of User Feedback
Guande Wu, Shunan Guo, J. Hoffswell, G. Chan, R. Rossi, E. Koh
2023
View Paper
Wizualization: A “Hard Magic” Visualization System for Immersive and Ubiquitous Analytics
A. Batch, P. Butcher, Panagiotis D. Ritsos, N. Elmqvist
2023
View Paper
NL2Color: Refining Color Palettes for Charts with Natural Language
Chuhan Shi, Weiwei Cui, Chengzhong Liu, Chengbo Zheng, Haidong Zhang, Qiong Luo, Xiaojuan Ma
2023
View Paper
Enabling Multimodal User Interactions for Genomics Visualization Creation
Qianwen Wang, Xiao Liu, Man Qing Liang, S. L’Yi, Nils Gehlenborg
2023
View Paper
Fostering Enterprise Conversations Around Data on Collaboration Platforms
Hyeok Kim, Arjun Srinivasan, Matthew Brehmer
2023
View Paper
Where Are We So Far? Understanding Data Storytelling Tools from the Perspective of Human-AI Collaboration
Haotian Li, Yun Wang, Huamin Qu
2023
View Paper
Show It or Tell It? Text, Visualization, and Their Combination
Marti A. Hearst
2023
View Paper
Development of android-based educational games about the domain of educational technology
Jason Moscato
2023
View Paper
Automatic Data Visualization Generation from Chinese Natural Language Questions
Yan Ge, Victor Junqiu Wei, Yuanfeng Song, C. Zhang, Raymond Chi-Wing Wong
2023
View Paper
Reviving Static Charts into Live Charts
Lu Ying, Yun Wang, Haotian Li, Shuguang Dou, Haidong Zhang, Xinyang Jiang, Huamin Qu, Yingcai Wu
2023
View Paper
Marrying Dialogue Systems with Data Visualization: Interactive Data Visualization Generation from Natural Language Conversations
Yuanfeng Song, Xuefang Zhao, Raymond Chi-Wing Wong
2023
View Paper
InkSight: Leveraging Sketch Interaction for Documenting Chart Findings in Computational Notebooks
Yanna Lin, Haotian Li, Leni Yang, Aoyu Wu, Huamin Qu
2023
View Paper
AutoTitle: An Interactive Title Generator for Visualizations
Can Liu, Y. Guo, Xiaoru Yuan
2023
View Paper
Designing an infographic webtool for public health
Riley Cullen, Elizabeth M. Heitkemper, Uba Backonja, B. Bekemeier, Ha-Kyung Kong
2023
View Paper
The State of the Art in Creating Visualization Corpora for Automated Chart Analysis
Chen Chen, Zhicheng Liu
2023
View Paper
Graphologue: Exploring Large Language Model Responses with Interactive Diagrams
Peiling Jiang, Jude Rayan, Steven W. Dow, Haijun Xia
2023
View Paper
Let the Chart Spark: Embedding Semantic Context into Chart with Text-to-Image Generative Model
Shishi Xiao, Suizi Huang, Yue Lin, Yilin Ye, Weizhen Zeng
2023
View Paper
Charagraph: Interactive Generation of Charts for Realtime Annotation of Data-Rich Paragraphs
Damien Masson, Sylvain Malacria, Géry Casiez, Daniel Vogel
2023
View Paper
Why is AI not a Panacea for Data Workers? An Interview Study on Human-AI Collaboration in Data Storytelling
Haotian Li, Yun Wang, Q. Liao, Huamin Qu
2023
View Paper
Research Approaches for Building Analytics in Social Network towards Crowdsourcing
Nivedita Kasturi, S. Totad, Goldina Ghosh
2023
View Paper
viz2viz: Prompt-driven stylized visualization generation using a diffusion model
Jiaqi Wu, John Joon Young Chung, Eytan Adar
2023
View Paper
Image-Driven Harmonious Color Palette Generation for Diverse Information Visualization
Shuqi Liu, Mingtian Tao, Yifei Huang, Changbo Wang, Chenhui Li
2022
View Paper
NL2Viz: natural language to visualization via constrained syntax-guided synthesis
Zhengkai Wu, Vu Le, A. Tiwari, Sumit Gulwani, Arjun Radhakrishna, Ivan Radicek, Gustavo Soares, Xinyu Wang, Zhenwen Li, Tao Xie
2022
View Paper
AskYourDB: An end-to-end system for querying and visualizing relational databases using natural language
Manu Joseph, Harsh Raj, Anubhav Yadav, Aaryaman Sharma
2022
View Paper
FlowNL: Asking the Flow Data in Natural Languages
Jieyin Huang, Yang Xi, Junnan Hu, Jun Tao
2022
View Paper
Supporting Expressive and Faithful Pictorial Visualization Design with Visual Style Transfer
Yang Shi, Pei Liu, Siji Chen, Mengdi Sun, Nan Cao
2022
View Paper
VizBelle: A Design Space of Embellishments for Data Visualization
Qing Chen, Ziyang Liu, Cheng-jui Wang, Xingyu Lan, Y. Chen, Siming Chen, Nan Cao
2022
View Paper
Sporthesia: Augmenting Sports Videos Using Natural Language
Zhutian Chen, Qisen Yang, Xiao Xie, Johanna Beyer, Haijun Xia, Yingnian Wu, H. Pfister
2022
View Paper
Erato: Cooperative Data Story Editing via Fact Interpolation
Mengdi Sun, Ligan Cai, Weiwei Cui, Yanqiu Wu, Yang Shi, Nan Cao
2022
View Paper
FEDEX: An Explainability Framework for Data Exploration Steps
Daniel Deutch, Amir Gilad, Tova Milo, Amit Mualem, Amit Somech
2022
View Paper
A Machine Learning Approach to Visual Insight Discovery in Multidimensional Hierarchical Data
Guijuan Wang, Boyou Tan, Zhong Wang, Jiansong Wang, Hao Guo, Yadong Wu
2022
View Paper
RGVisNet: A Hybrid Retrieval-Generation Neural Framework Towards Automatic Data Visualization Generation
Yuanfeng Song, Xuefang Zhao, Raymond Chi-Wing Wong, Di Jiang
2022
View Paper
An Ontological Approach towards Automatic Creation of Infographics from Formal Text (Student Abstract)
Devin Garg, Tanuj Agarwal, Chiranjoy Chattopadhyay
2022
View Paper
Designing Infographics: Visual Representations for Enhancing Education, Communication, and Scientific Research
L. Traboco, H. Pandian, E. Nikiphorou, Latika Gupta
2022
View Paper
How Does Automation Shape the Process of Narrative Visualization: A Survey of Tools
Qing Chen, Shixiong Cao, Jiazhe Wang, Nan Cao
2022
View Paper
Sevi: Speech-to-Visualization through Neural Machine Translation
Jiawei Tang, Yuyu Luo, M. Ouzzani, Guoliang Li, Hongyang Chen
2022
View Paper
Chart Question Answering: State of the Art and Future Directions
Enamul Hoque, P. Kavehzadeh, Ahmed Masry
2022
View Paper
CrossData: Leveraging Text-Data Connections for Authoring Data Documents
Zhutian Chen, Haijun Xia
2022
View Paper
Infographics Wizard: Flexible Infographics Authoring and Design Exploration
Anjul Tyagi, J. Zhao, Pushkar Patel, Swasti Khurana, Klaus Mueller
2022
View Paper
OneLabeler: A Flexible System for Building Data Labeling Tools
Yu Zhang, Yun Wang, Haidong Zhang, Bin Zhu, Si Chen, Dongmei Zhang
2022
View Paper
How do you Converse with an Analytical Chatbot? Revisiting Gricean Maxims for Designing Analytical Conversational Behavior
V. Setlur, Melanie Tory
2022
View Paper
Roslingifier: Semi-Automated Storytelling for Animated Scatterplots
Minjeong Shin, Joohee Kim, Yunha Han, Lexing Xie, M. Whitelaw, Bum Chul Kwon, Sungahn Ko, N. Elmqvist
2022
View Paper
ChartText: Linking Text with Charts in Documents
J. Pinheiro, Jorge Poco
2022
View Paper
Az infografika készítése, jövője és könyvtári lehetőségei
Baratiné Sipos Lilla Kinga
2021
View Paper
Graph-Based Information Block Detection in Infographic with Gestalt Organization Principles
Jie Lin, Yi Cai, Xin Wu, Jianwei Lu
2021
View Paper
Natural Language to Visualization by Neural Machine Translation
Yuyu Luo, N. Tang, Guoliang Li, Jiawei Tang, Chengliang Chai, Xuedi Qin
2021
View Paper
Part & Whole Extraction: Towards A Deep Understanding of Quantitative Facts for Percentages in Text
Lei Fang, Jian-Guang Lou
2021
View Paper
A Mixed-Initiative Approach to Reusing Infographie Charts
Weiwei Cui, Jinpeng Wang, He Huang, Yun Wang, Chin-Yew Lin, Haidong Zhang, Dongmei Zhang
2021
View Paper
Towards Natural Language Interfaces for Data Visualization: A Survey
Leixian Shen, Enya Shen, Yuyu Luo, Xiaocong Yang, Xuming Hu, Xiongshuai Zhang, Zhiwei Tai, Jianmin Wang
2021
View Paper
A Review and Collation of Graphical Perception Knowledge for Visualization Recommendation
Zehua Zeng, L. Battle
2021
View Paper
User-Centric Semi-Automated Infographics Authoring and Recommendation
Anjul Tyagi, Jian Zhao, Pushkar Patel, Swasti Khurana, Klaus Mueller
2021
View Paper
Propagating Visual Designs to Numerous Plots and Dashboards
Saiful Khan, P. H. Nguyen, Alfie Abdul-Rahman, B. Bach, Min Chen, Euan Freeman, C. Turkay
2021
View Paper
AniVis: Generating Animated Transitions Between Statistical Charts with a Tree Model
Wenchao Li, Yun Wang, He Huang, Weiwei Cui, Haidong Zhang, Huamin Qu, Dongmei Zhang
2021
View Paper
Synthesizing Natural Language to Visualization (NL2VIS) Benchmarks from NL2SQL Benchmarks
Yuyu Luo, N. Tang, Guoliang Li, Chengliang Chai, Wenbo Li, Xuedi Qin
2021
View Paper
Animated Presentation of Static Infographics with InfoMotion
Yun Wang, Yi Gao, R. Huang, Weiwei Cui, Haidong Zhang, Dongmei Zhang
2021
View Paper
Collecting and Characterizing Natural Language Utterances for Specifying Data Visualizations
Arjun Srinivasan, Nikhila Nyapathy, Bongshin Lee, S. Drucker, J. Stasko
2021
View Paper
Interpreting the Effect of Embellishment on Chart Visualizations
Tiffany Andry, C. Hurter, F. Lambotte, P. Fastrez, A. Telea
2021
View Paper
Smile or Scowl? Looking at Infographic Design Through the Affective Lens
Xingyu Lan, Yang Shi, Yueyao Zhang, Nan Cao
2021
View Paper
Text2Chart: A Multi-Staged Chart Generator from Natural Language Text
Md. Mahinur Rashid, Hasin Kawsar Jahan, Annysha Huzzat, Riyasaat Ahmed Rahul, Tamim Bin Zakir, F. Meem, Md. Saddam Hossain Mukta, Swakkhar Shatabda
2021
View Paper
Automatic Generation of Unit Visualization-based Scrollytelling for Impromptu Data Facts Delivery
Junhua Lu, Wei Chen, Hui Ye, Jie Wang, Honghui Mei, Yuhui Gu, Yingcai Wu, X. Zhang, K. Ma
2021
View Paper
InfoColorizer: Interactive Recommendation of Color Palettes for Infographics
Linping Yuan, Ziqi Zhou, Jian Zhao, Yiqiu Guo, F. Du, Huamin Qu
2021
View Paper
AI4VIS: Survey on Artificial Intelligence Approaches for Data Visualization
Aoyu Wu, Yun Wang, Xinhuan Shu, Dominik Moritz, Weiwei Cui, Haidong Zhang, Dongmei Zhang, Huamin Qu
2021
View Paper
Q4EDA: A Novel Strategy for Textual Information Retrieval Based on User Interactions with Visual Representations of Time Series
L. Christino, M. D. Ferreira, F. Paulovich
2021
View Paper
Lumina: an adaptive, automated and extensible prototype for exploring, enriching and visualizing data
Konstantinos Kagkelidis, Ilias Dimitriadis, A. Vakali
2021
View Paper
Examining interaction techniques in data visualization authoring tools from the perspective of goals and human cognition: a survey
Sadia Rubab, Junxiu Tang, Yingcai Wu
2021
View Paper
A Survey on ML4VIS: Applying Machine Learning Advances to Data Visualization
Qianwen Wang, Zhutian Chen, Yong Wang, Huamin Qu
2020
View Paper
Applying Machine Learning Advances to Data Visualization: A Survey on ML4VIS
Qianwen Wang, Zhutian Chen, Yong Wang, Huamin Qu
2020
View Paper
Crosspower: Bridging Graphics and Linguistics
Haijun Xia
2020
View Paper
Calliope: Automatic Visual Data Story Generation from a Spreadsheet
Danqing Shi, Xinyue Xu, F. Sun, Yang Shi, Nan Cao
2020
View Paper
A survey on automatic infographics and visualization recommendations
Sujia Zhu, Guodao Sun, Qi Jiang, Meng Zha, Ronghua Liang
2020
View Paper
Retrieve-Then-Adapt: Example-based Automatic Generation for Proportion-related Infographics
Chunyao Qian, Shizhao Sun, Weiwei Cui, Jian-Guang Lou, Haidong Zhang, Dongmei Zhang
2020
View Paper
Smarttext: Learning To Generate Harmonious Textual Layout Over Natural Image
Peiying Zhang, Chenhui Li, Changbo Wang
2020
View Paper
Infomages: Embedding Data into Thematic Images
Darius Coelho, Klaus Mueller
2020
View Paper
Quda: Natural Language Queries for Visual Data Analytics
Siwei Fu, Kai Xiong, Xiaodong Ge, Yingcai Wu, Siliang Tang, Wei Chen
2020
View Paper
DataQuilt: Extracting Visual Elements from Images to Craft Pictorial Visualizations
J. Zhang, N. Sultanum, A. Bezerianos, Fanny Chevalier
2020
View Paper
Automatic Annotation Synchronizing with Textual Description for Visualization
Chufan Lai, Zhixian Lin, Ruike Jiang, Yun Han, Can Liu, Xiaoru Yuan
2020
View Paper
ConceptScope: Organizing and Visualizing Knowledge in Documents based on Domain Ontology
Xiaoyu Zhang, Senthil K. Chandrasegaran, K. Ma
2020
View Paper
Parsing and Summarizing Infographics with Synthetically Trained Icon Detection
Spandan Madan, Z. Bylinskii, Matthew Tancik, Adrià Recasens, Kimberli Zhong, Sami Alsheikh, H. Pfister, A. Oliva, F. Durand
2018
View Paper
Towards Automated Infographic Authoring From Natural Language Statement With Multiple Proportional Facts
Jianwei Lu, Guohua Wang, Yi Cai, Xin Wu
2024
View Paper
Automatic Layout Algorithm for Graphic Language in Visual Communication Design
X. Liao, Xinqian Hu
2023
View Paper
mTreeIllustrator: A Mixed-Initiative Framework for Visual Exploratory Analysis of Multidimensional Hierarchical Data
Guijuan Wang, Yu Zhao, Boyou Tan, Zhong Wang, Jiansong Wang, Hao Guo, Yadong Wu
2023
View Paper
DPVis: Automatic Visual Encoding Based on Deep Learning
Jia Liu, Gang Wan, Panke Deng, Chu Li, Shuai Wang, Yunxia Yin, Lei Liu, Yao Mu
2023
View Paper
Harmonious Textual Layout Generation Over Natural Images via Deep Aesthetics Learning
Chenhui Li, Peiying Zhang, Changbo Wang
2022
View Paper
Infographics Wizard: Flexible Infographics Authoring and Design Exploration
Tobias Schreck
2022
View Paper
Are We There Yet? A Systematic Review of Visual Perception Knowledge for Visualization Recommendation Systems
Zehua Zeng, L. Battle
2022
View Paper
The Why and The How: A Survey on Natural Language Interaction in Visualization
Henrik Voigt, Ozge Alacam, M. Meuschke, K. Lawonn, Sina Zarrieß
2022
View Paper
Survey on Artificial Intelligence Approaches for Visualization Data
Aoyu Wu, Yun Wang, Xinhuan Shu, Dominik Moritz, Weiwei Cui, Haidong Zhang, Dongmei Zhang, Huamin Qu
2021
View Paper
Explainable Patterns: Going from Findings to Insights to Support Data Analytics Democratization
L. Christino, M. D. Ferreira, Asal Jalilvand, F. Paulovich
2021
View Paper
Exploring the "Double-Edged Sword" Effect of Auto-Insight Recommendation in Exploratory Data Analysis
Quan Li, Huanbin Lin, C. Tang, Xiguang Wei, Zhenhui Peng, Xiaojuan Ma, Tianjian Chen
2021
View Paper
Aunt Lily Can Say Her Visualizations: Directing Analysis, Design, and Storytelling in Natural Language (A Vision)
Zening Qu, F. Du, R. Rossi
2021
View Paper

Comments (0)

This website uses cookies to ensure you get the best experience. Learn more