Text2Insight: Transform natural language text into insights seamlessly using multi-model architecture
Publication
Metrics
AI Quick Summary
Text2Insight utilizes a multi-model architecture to convert natural language queries into customized data analyses and dynamic visualizations, achieving high accuracy and precision. It leverages models like Llama3 and BERT for SQL query generation, visualization type determination, and predictive analysis, delivering user-specific insights and trends.
Paper Preview
Abstract
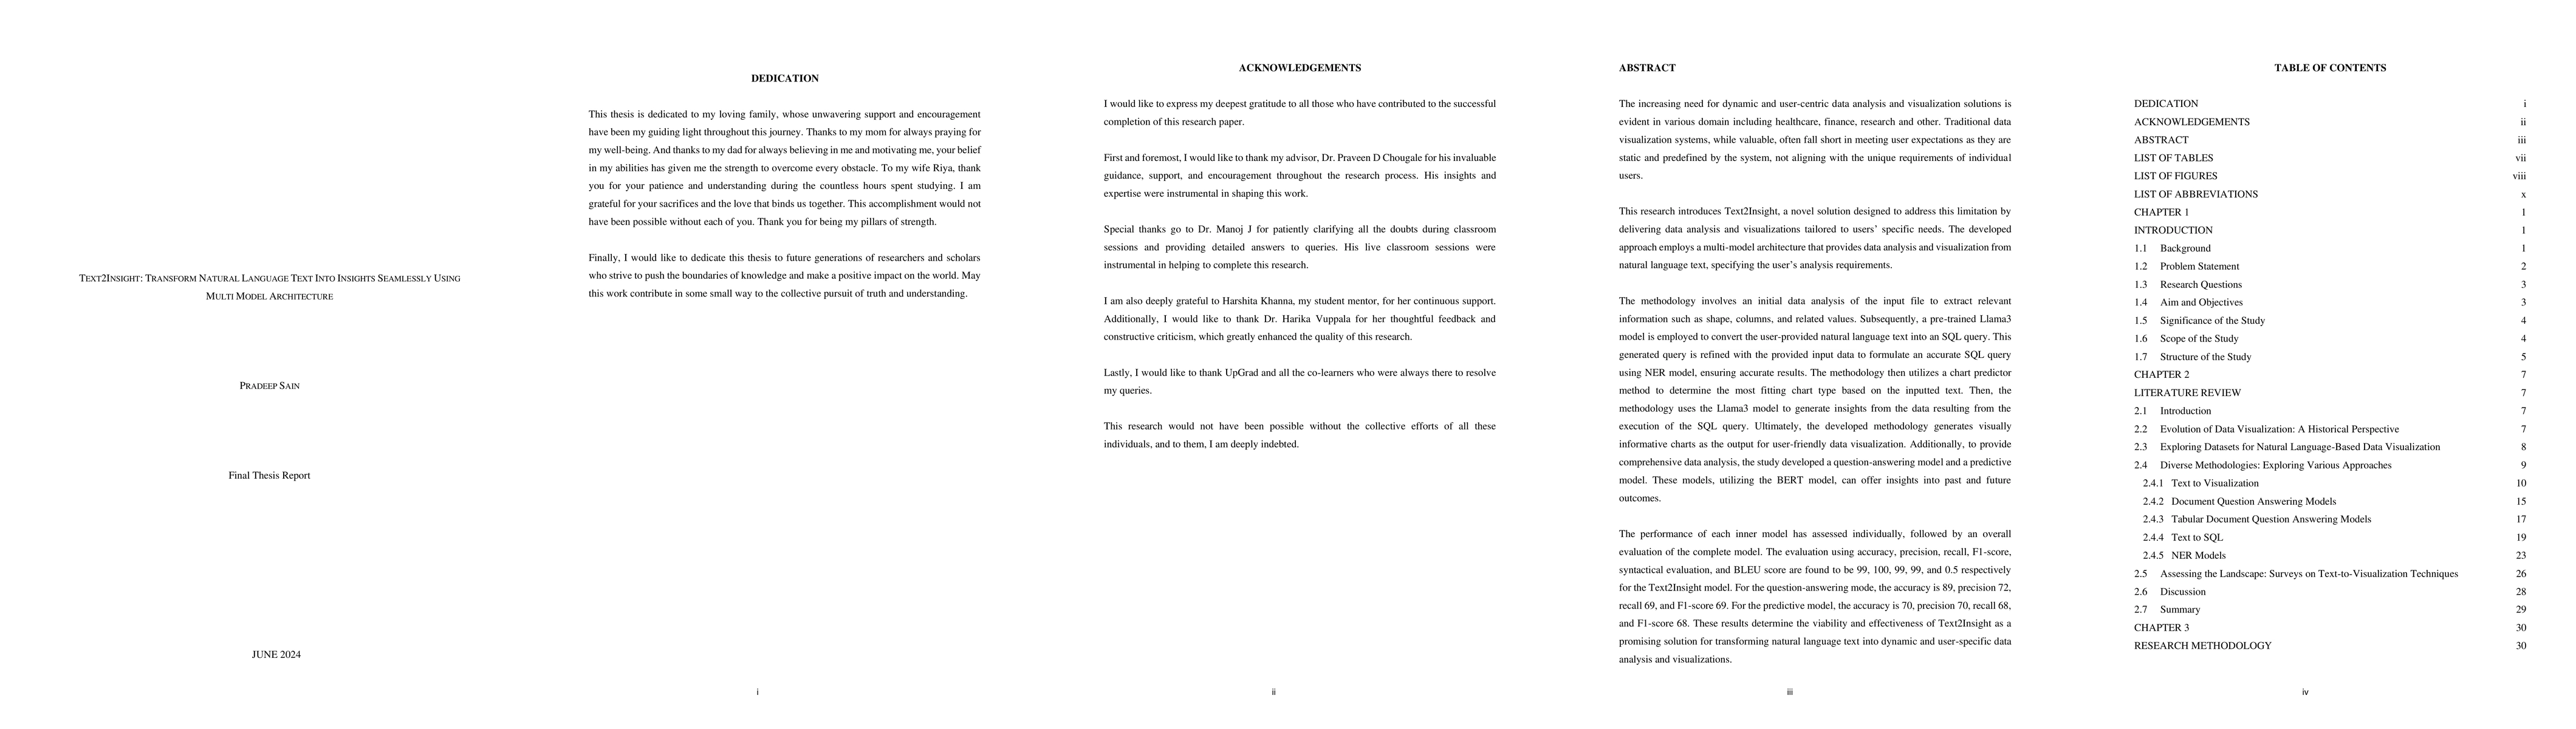
The growing demand for dynamic, user-centric data analysis and visualization is evident across domains like healthcare, finance, and research. Traditional visualization tools often fail to meet individual user needs due to their static and predefined nature. To address this gap, Text2Insight is introduced as an innovative solution that delivers customized data analysis and visualizations based on user-defined natural language requirements. Leveraging a multi-model architecture, Text2Insight transforms user inputs into actionable insights and dynamic visualizations. The methodology begins with analyzing the input dataset to extract structural details such as columns and values. A pre-trained Llama3 model converts the user's natural language query into an SQL query, which is further refined using a Named Entity Recognition (NER) model for accuracy. A chart predictor determines the most suitable visualization type, while the Llama3 model generates insights based on the SQL query's results. The output is a user-friendly and visually informative chart. To enhance analysis capabilities, the system integrates a question-answering model and a predictive model using the BERT framework. These models provide insights into historical data and predict future trends. Performance evaluation of Text2Insight demonstrates its effectiveness, achieving high accuracy (99%), precision (100%), recall (99%), and F1-score (99%), with a BLEU score of 0.5. The question-answering model attained an accuracy of 89% and the predictive model achieved 70% accuracy. These results validate Text2Insight as a robust and viable solution for transforming natural language text into dynamic, user-specific data analysis and visualizations.
AI Key Findings
Get AI-generated insights about this paper's methodology, results, significance, and more — seven facets brought into focus.
Authors
PDF Preview
Related Papers
No references found for this paper.
Discussion 0