Publication
Metrics
AI Quick Summary
This study analyzes galaxy clustering in the ALHAMBRA survey from $z \sim 0.35$ to $1.25$, revealing a strong luminosity dependence in bias for intermediate and bright galaxies, while fainter galaxies show a flatter relation, suggesting diverse halo masses for different luminosity samples.
Paper Preview
Abstract
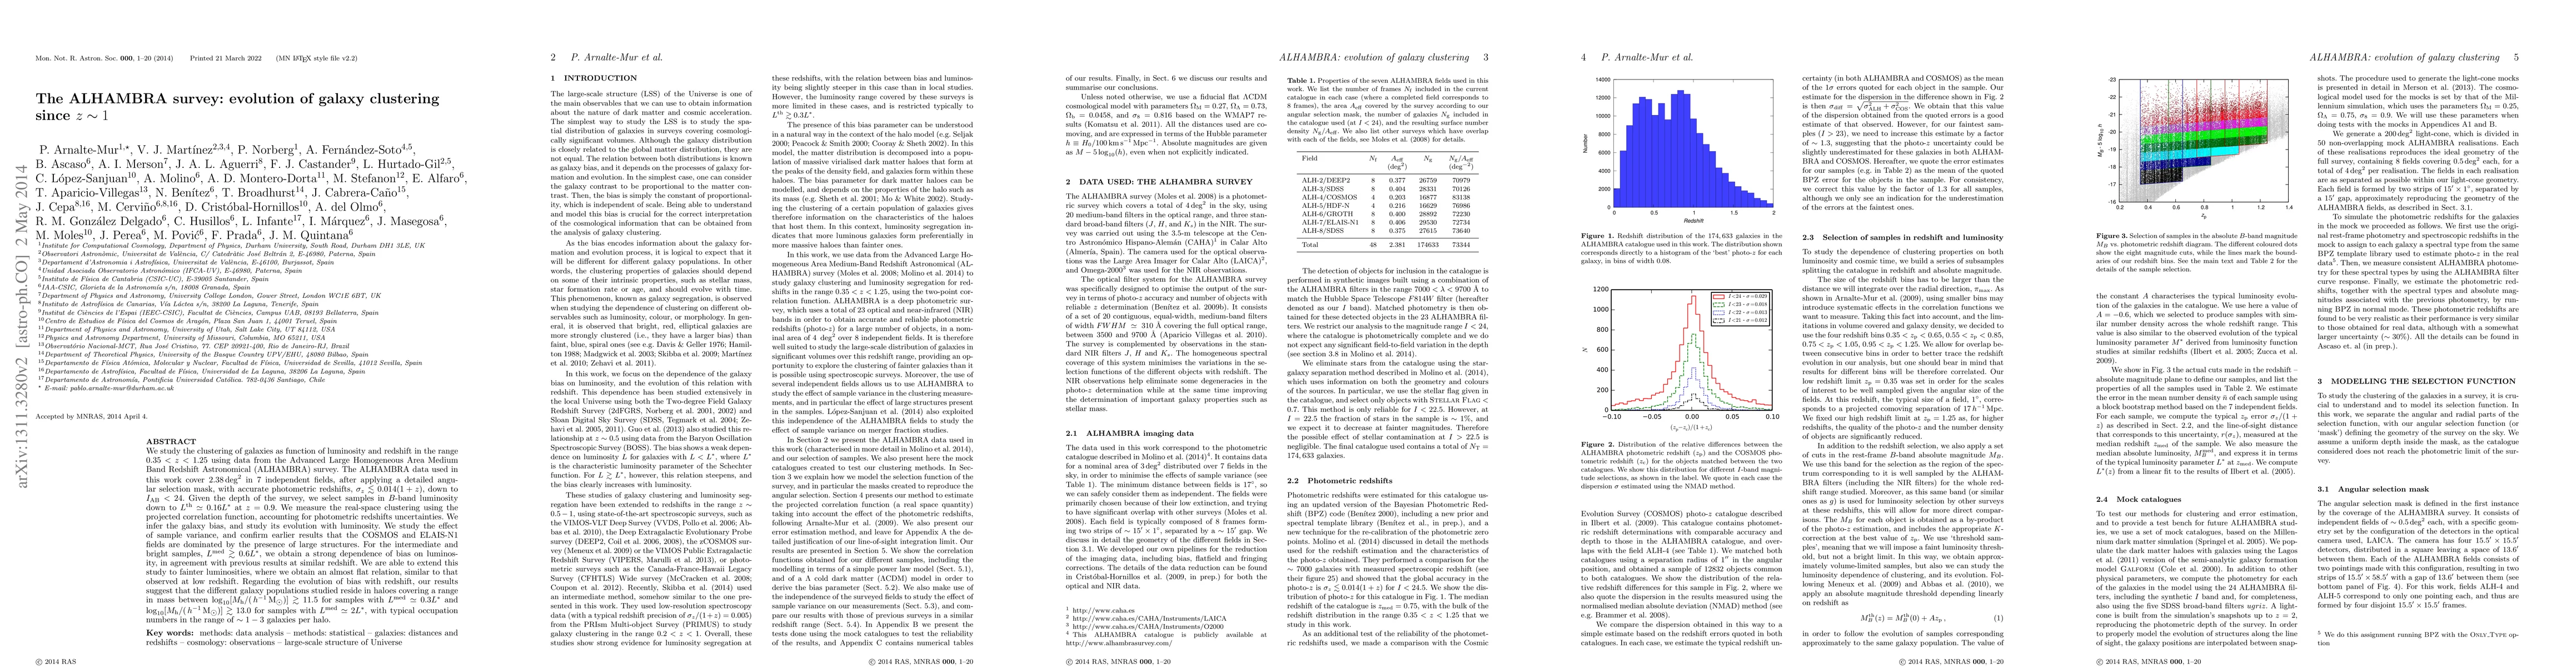
We study the clustering of galaxies as function of luminosity and redshift in the range $0.35 < z < 1.25$ using data from the Advanced Large Homogeneous Area Medium Band Redshift Astronomical (ALHAMBRA) survey. The ALHAMBRA data used in this work cover $2.38 \mathrm{deg}^2$ in 7 independent fields, after applying a detailed angular selection mask, with accurate photometric redshifts, $\sigma_z \lesssim 0.014 (1+z)$, down to $I_{\rm AB} < 24$. Given the depth of the survey, we select samples in $B$-band luminosity down to $L^{\rm th} \simeq 0.16 L^{*}$ at $z = 0.9$. We measure the real-space clustering using the projected correlation function, accounting for photometric redshifts uncertainties. We infer the galaxy bias, and study its evolution with luminosity. We study the effect of sample variance, and confirm earlier results that the COSMOS and ELAIS-N1 fields are dominated by the presence of large structures. For the intermediate and bright samples, $L^{\rm med} \gtrsim 0.6L^{*}$, we obtain a strong dependence of bias on luminosity, in agreement with previous results at similar redshift. We are able to extend this study to fainter luminosities, where we obtain an almost flat relation, similar to that observed at low redshift. Regarding the evolution of bias with redshift, our results suggest that the different galaxy populations studied reside in haloes covering a range in mass between $\log_{10}[M_{\rm h}/(h^{-1}\mathrm{M}_{\odot})] \gtrsim 11.5$ for samples with $L^{\rm med} \simeq 0.3 L^{*}$ and $\log_{10}[M_{\rm h}/(h^{-1}\mathrm{M}_{\odot})] \gtrsim 13.0$ for samples with $L^{\rm med} \simeq 2 L^{*}$, with typical occupation numbers in the range of $\sim 1 - 3$ galaxies per halo.
AI Key Findings
Get AI-generated insights about this paper's methodology, results, significance, and more — seven facets brought into focus.
Impact
Paper Details
PDF Preview
Key Terms
Citation Network
Current paper (gray), citations (green), references (blue)
Display is limited for performance on very large graphs.
Discussion 0