Summary
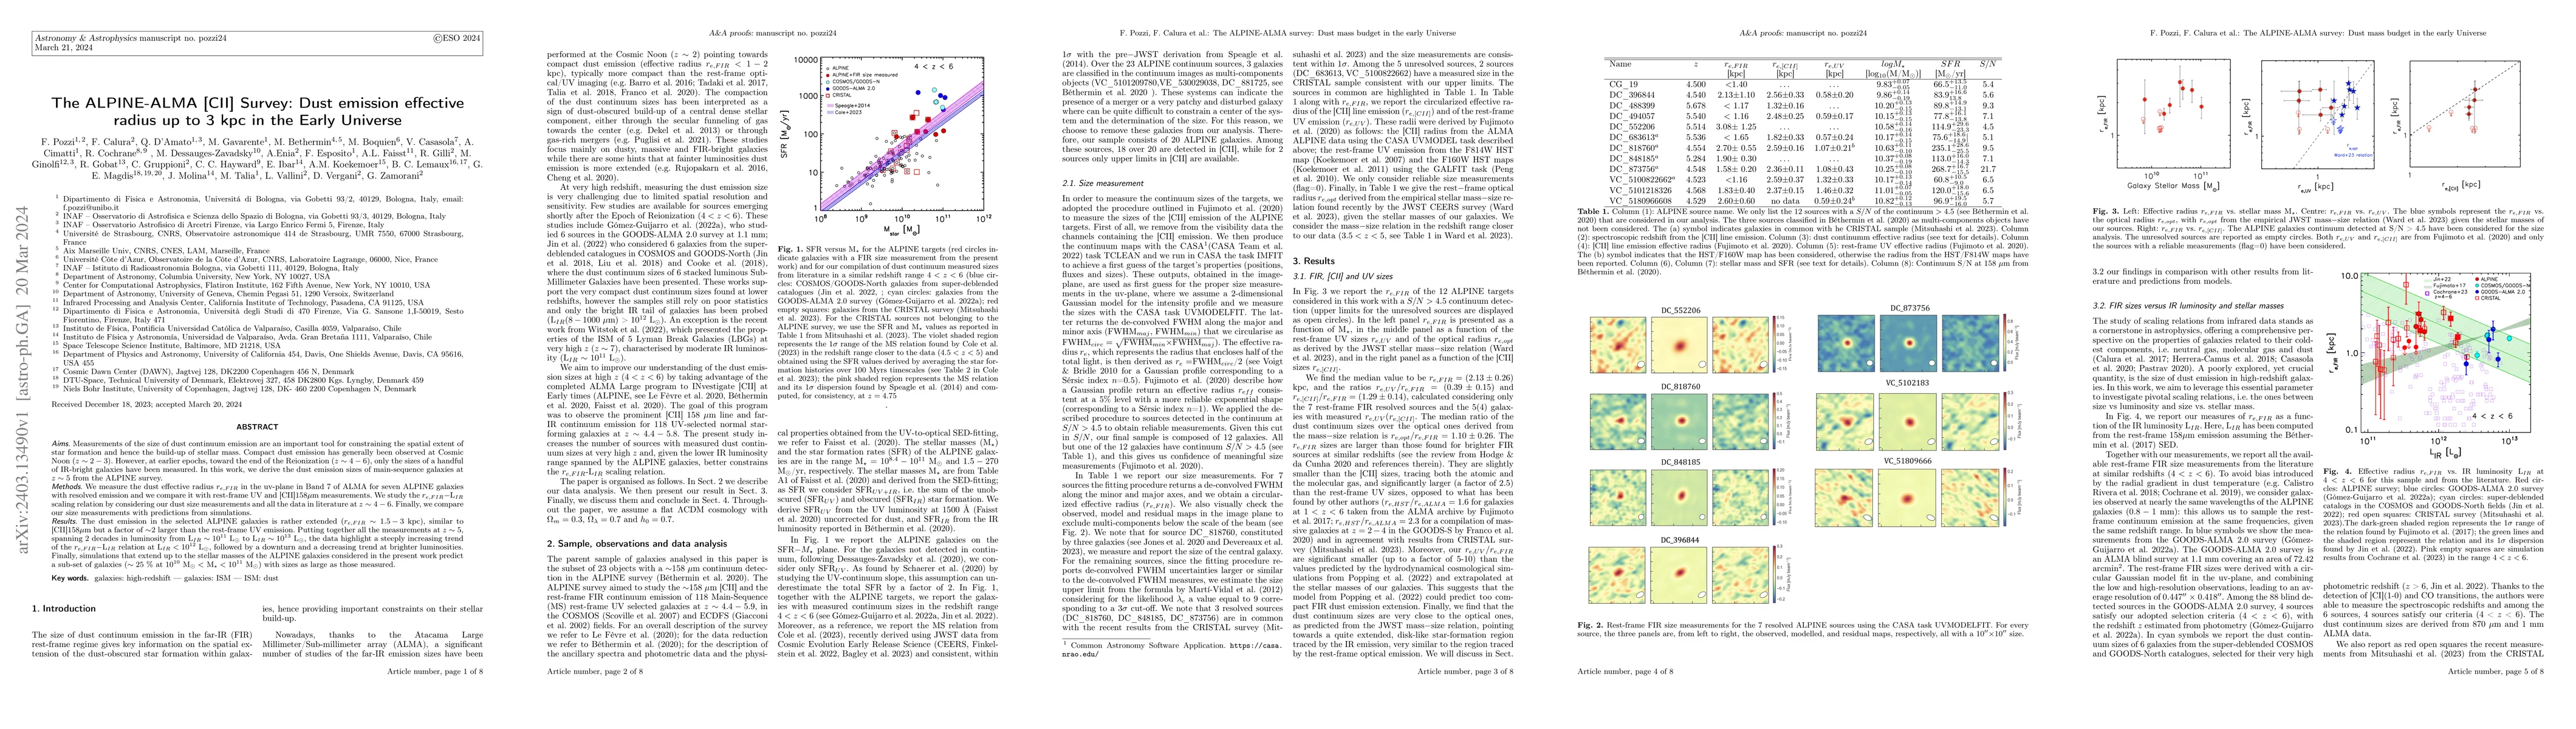
Measurements of the size of dust continuum emission are an important tool for constraining the spatial extent of star formation and hence the build-up of stellar mass. Compact dust emission has generally been observed at Cosmic Noon (z~2-3). However, at earlier epochs, toward the end of the Reionization (z~4-6), only the sizes of a handful of IR-bright galaxies have been measured. In this work, we derive the dust emission sizes of main-sequence galaxies at z~5 from the ALPINE survey. We measure the dust effective radius r_e,FIR in the uv-plane in Band 7 of ALMA for seven ALPINE galaxies with resolved emission and we compare it with rest-frame UV and [CII]158$\mu$m measurements. We study the r_e,FIR-L_IR scaling relation by considering our dust size measurements and all the data in literature at z~4-6. Finally, we compare our size measurements with predictions from simulations. The dust emission in the selected ALPINE galaxies is rather extended (r_e,FIR~1.5-3 kpc), similar to [CII]158 um but a factor of ~2 larger than the rest-frame UV emission. Putting together all the measurements at z~5, spanning 2 decades in luminosity from L_IR ~ 10^11 L_sun to L_IR ~ 10^13 L_sun, the data highlight a steeply increasing trend of the r_e,FIR-L_IR relation at L_IR< 10^12 L_sun, followed by a downturn and a decreasing trend at brighter luminosities. Finally, simulations that extend up to the stellar masses of the ALPINE galaxies considered in the present work predict a sub-set of galaxies (~25% at 10^10 M_sun < M_star < 10^11 M_sun) with sizes as large as those measured.
AI Key Findings
Get AI-generated insights about this paper's methodology, results, and significance.
Paper Details
PDF Preview
Key Terms
Citation Network
Current paper (gray), citations (green), references (blue)
Display is limited for performance on very large graphs.
Similar Papers
Found 4 papers| Title | Authors | Year | Actions |
|---|
Comments (0)