Publication
Metrics
AI Quick Summary
Summary: This study uses G-band observations and simulations to analyze the area distribution of Magnetic Bright Points (MBPs) on the solar photosphere. An automatic detection algorithm identifies MBPs, revealing a log-normal distribution peaking at approximately 45,000 km², suggesting flux fragmentation dominance. The MBP size correlates with the typical width of intergranular lanes.
Paper Preview
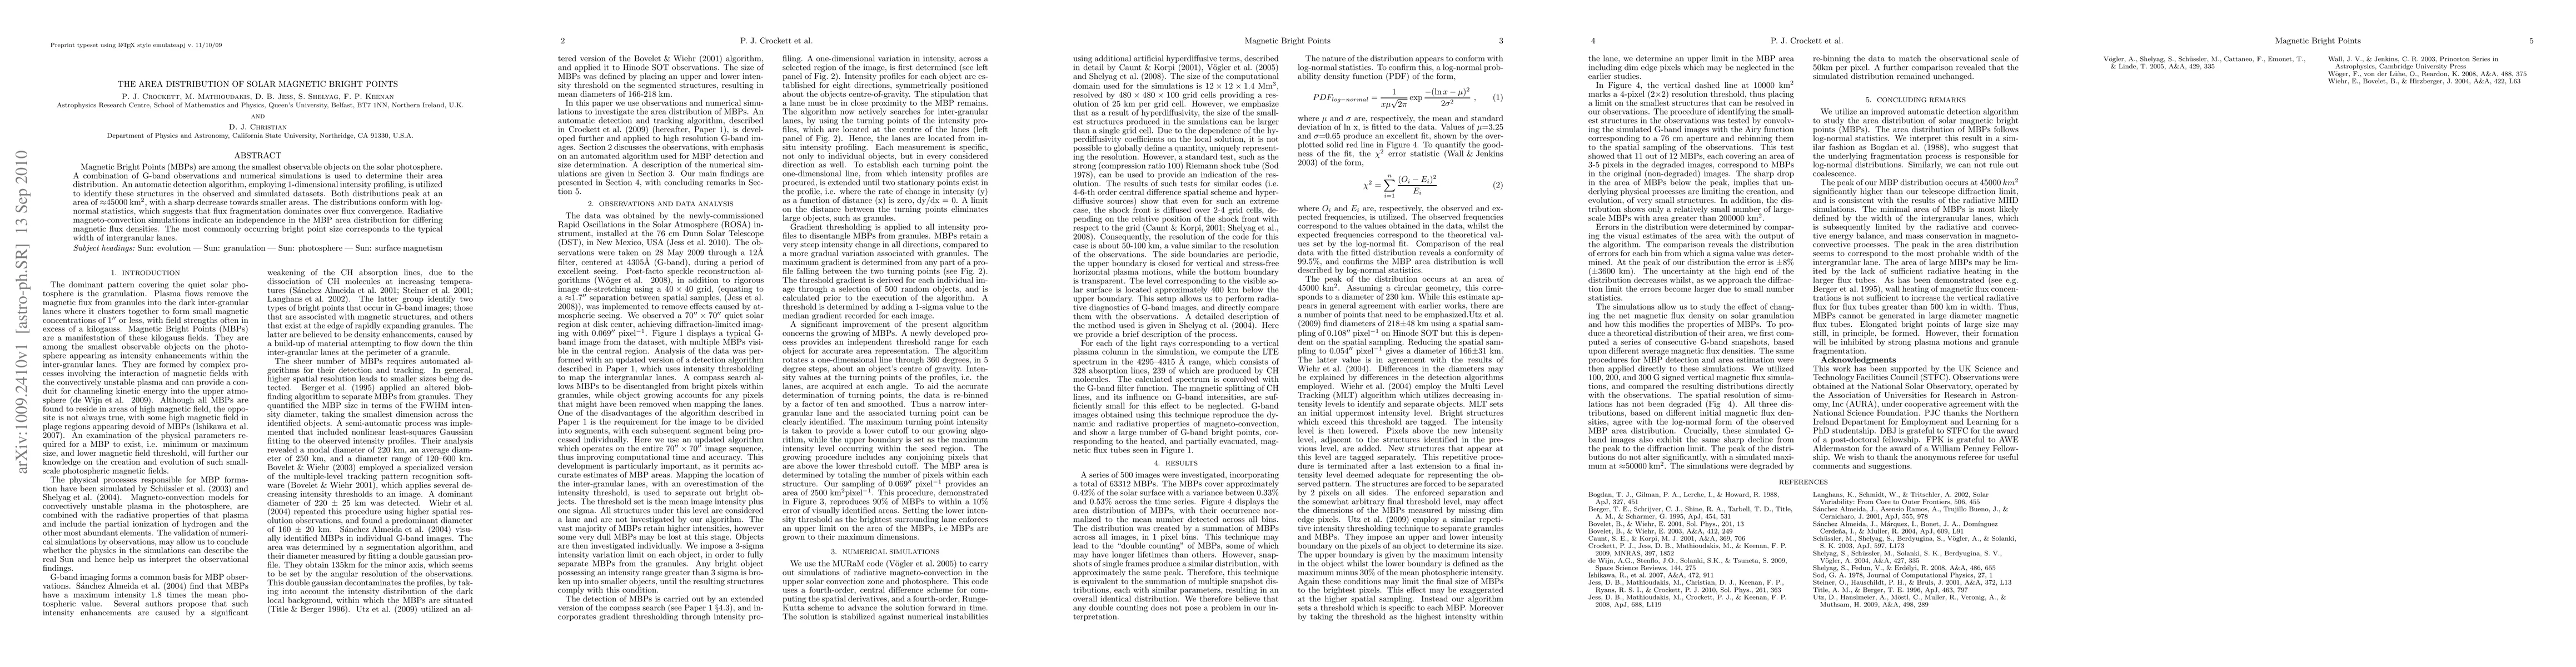
Abstract
Magnetic Bright Points (MBPs) are among the smallest observable objects on the solar photosphere. A combination of G-band observations and numerical simulations is used to determine their area distribution. An automatic detection algorithm, employing 1-dimensional intensity profiling, is utilized to identify these structures in the observed and simulated datasets. Both distributions peak at an area of $\approx$45000 km$^2$, with a sharp decrease towards smaller areas. The distributions conform with log-normal statistics, which suggests that flux fragmentation dominates over flux convergence. Radiative magneto-convection simulations indicate an independence in the MBP area distribution for differing magnetic flux densities. The most commonly occurring bright point size corresponds to the typical width of intergranular lanes.
AI Key Findings
Get AI-generated insights about this paper's methodology, results, significance, and more — seven facets brought into focus.
Impact
Paper Details
PDF Preview
Key Terms
Citation Network
Current paper (gray), citations (green), references (blue)
Display is limited for performance on very large graphs.
Discussion 0