Publication
Metrics
AI Quick Summary
This study uses Herschel PACS and SPIRE to image the thermal emission from the debris disk around β Pictoris, revealing a nearly symmetric disk with most emission originating within 200 AU. The small far-infrared spectral index suggests non-equilibrium grain size distribution, possibly due to non-equilibrium effects or radiation pressure removal of small impactors.
Paper Preview
Abstract
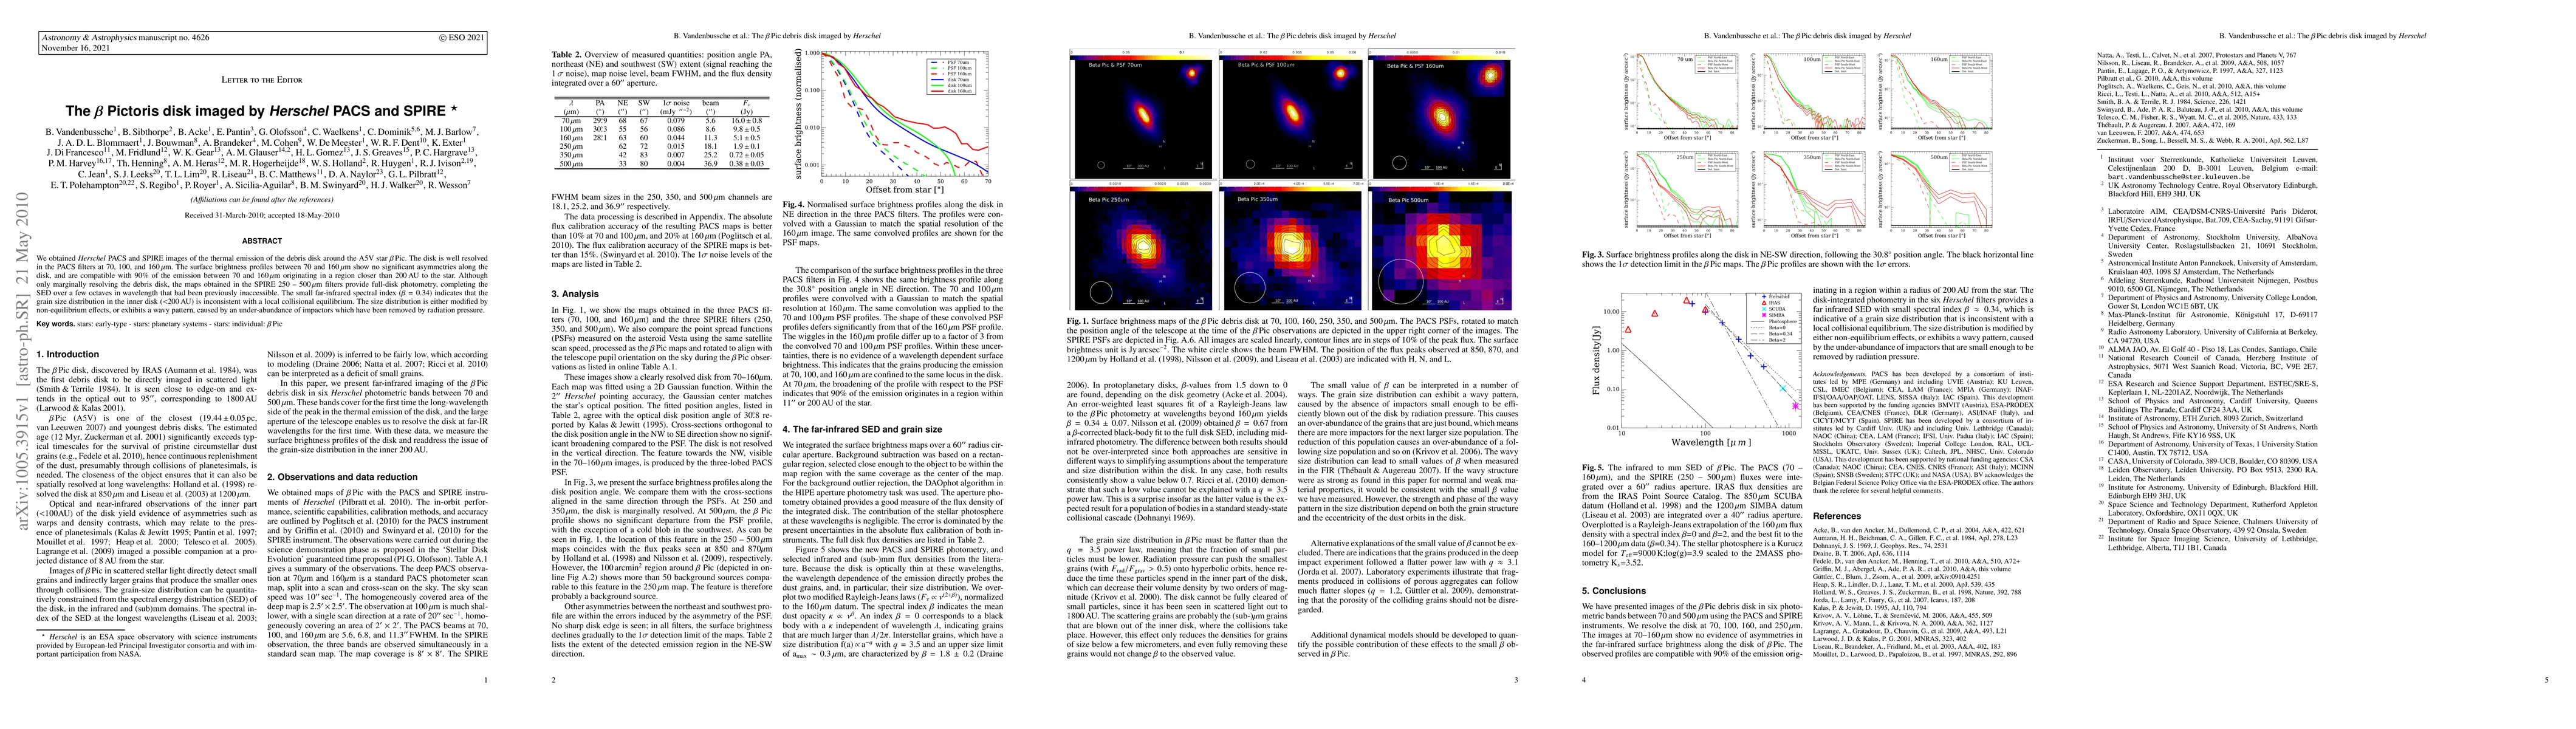
We obtained Herschel PACS and SPIRE images of the thermal emission of the debris disk around the A5V star {\beta} Pic. The disk is well resolved in the PACS filters at 70, 100, and 160 {\mu}m. The surface brightness profiles between 70 and 160 {\mu}m show no significant asymmetries along the disk, and are compatible with 90% of the emission between 70 and 160 {\mu}m originating in a region closer than 200 AU to the star. Although only marginally resolving the debris disk, the maps obtained in the SPIRE 250 - 500 {\mu}m filters provide full-disk photometry, completing the SED over a few octaves in wavelength that had been previously inaccessible. The small far-infrared spectral index ({\beta} = 0.34) indicates that the grain size distribution in the inner disk (<200AU) is inconsistent with a local collisional equilibrium. The size distribution is either modified by non-equilibrium effects, or exhibits a wavy pattern, caused by an under-abundance of impactors which have been removed by radiation pressure.
AI Key Findings
Get AI-generated insights about this paper's methodology, results, significance, and more — seven facets brought into focus.
Discussion 0