Summary
The Baldwin, Philips, & Terlevich diagram of [O III]/H$\beta$ vs. [N II]/H$\alpha$ (hereafter N2-BPT) has long been used as a tool for classifying galaxies based on the dominant source of ionizing radiation. Recent observations have demonstrated that galaxies at $z\sim2$ reside offset from local galaxies in the N2-BPT space. In this paper, we conduct a series of controlled numerical experiments to understand the potential physical processes driving this offset. We model nebular line emission in a large sample of galaxies, taken from the SIMBA cosmological hydrodynamic galaxy formation simulation, using the CLOUDY photoionization code to compute the nebular line luminosities from H II regions. We find that the observed shift toward higher [O III]/H$\beta$ and [N II]/H$\alpha$ values at high redshift arises from sample selection: when we consider only the most massive galaxies $M_* \sim 10^{10-11} M_\odot$, the offset naturally appears, due to their high metallicities. We predict that deeper observations that probe lower-mass galaxies will reveal galaxies that lie on a locus comparable to $z\sim 0$ observations. Even when accounting for sample selection effects, we find that there is a subtle mismatch between simulations and observations. To resolve this discrepancy, we investigate the impact of varying ionization parameters, H II region densities, gas-phase abundance patterns, and increasing radiation field hardness on N2-BPT diagrams. We find that either decreasing the ionization parameter or increasing the N/O ratio of galaxies at fixed O/H can move galaxies along a self-similar arc in N2-BPT space that is occupied by high-redshift galaxies.
AI Key Findings
Generated Sep 03, 2025
Methodology
The research employs a novel model for calculating nebular emission line spectra on a particle-by-particle basis from cosmological galaxy formation simulations to investigate high-redshift N2-BPT space offsets.
Key Results
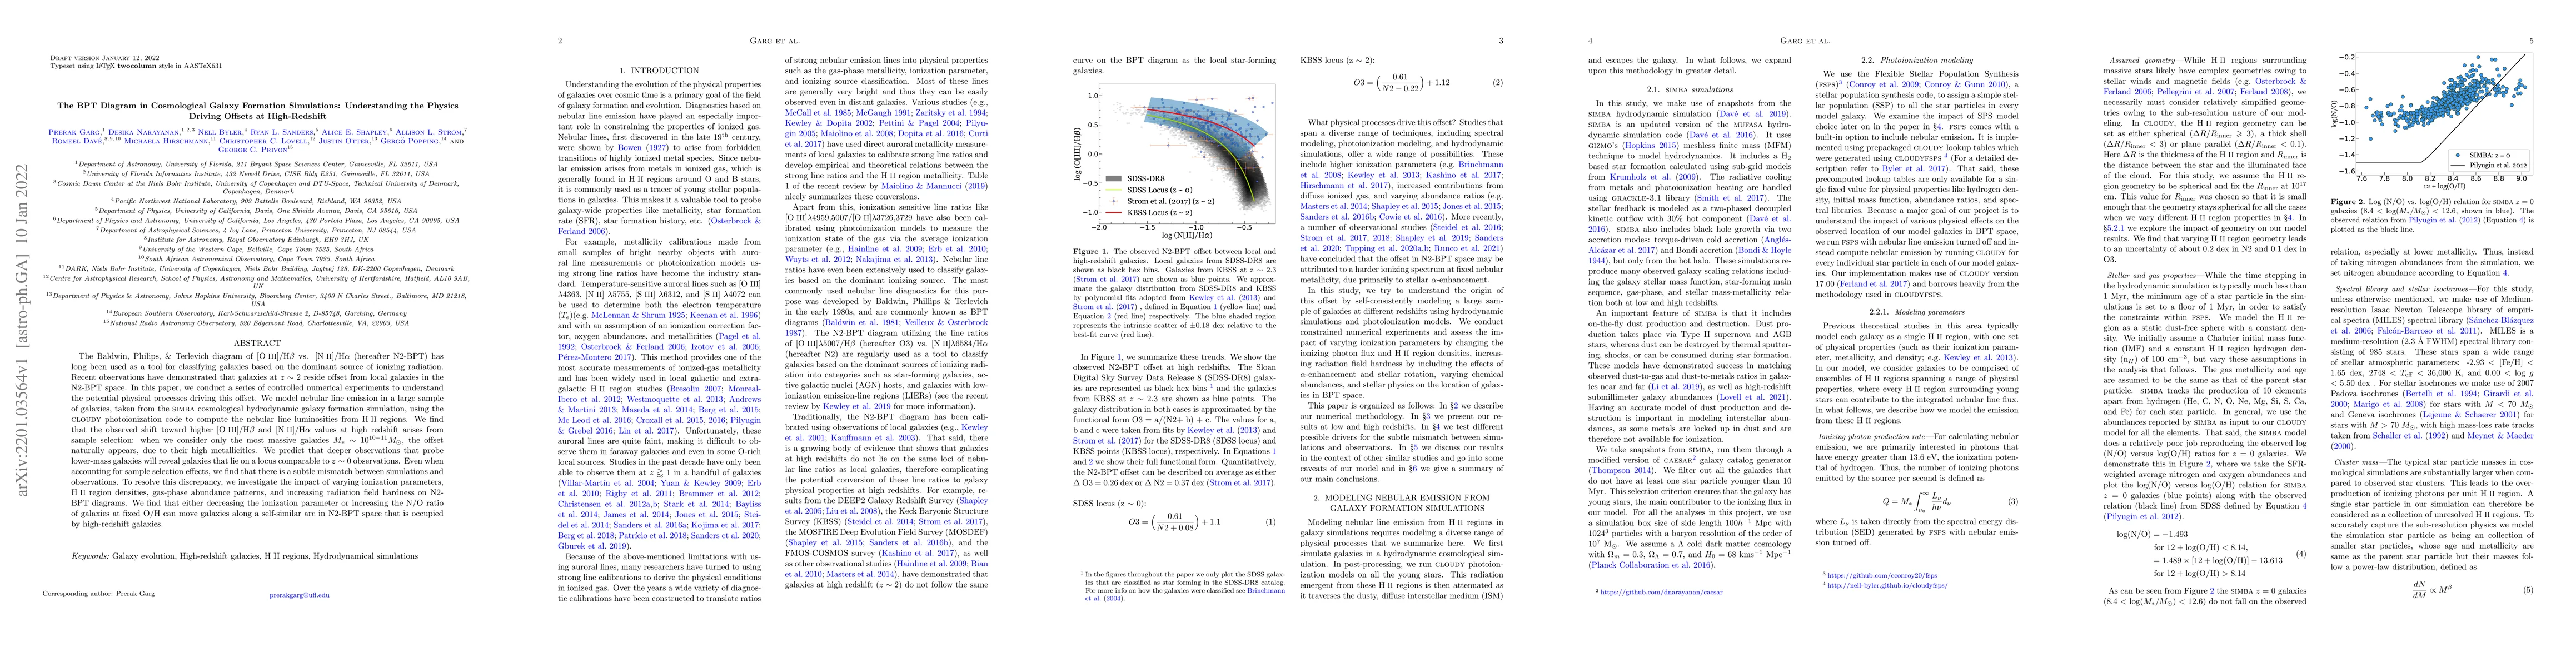
- The model successfully reproduces the observed SDSS-DR8 N2-BPT curve.
- The N2-BPT offset at high-z primarily arises from sample selection effects, with deeper observations revealing galaxies on a locus comparable to z~0 observations.
Significance
This study provides insights into the physical processes driving high-redshift galaxy evolution and offers a method for modeling nebular emission lines directly from simulations, contributing to the understanding of galaxy formation and evolution.
Technical Contribution
The development of a novel method for calculating nebular emission line spectra directly from cosmological galaxy formation simulations, providing a more accurate representation of galaxy properties.
Novelty
This research introduces a unique, particle-by-particle modeling approach for nebular emission lines, offering a more comprehensive understanding of high-redshift galaxy properties compared to previous studies.
Limitations
- Uncertainties exist due to HII region geometry and the lack of dust physics within HII regions.
- The model does not account for diffused ionized gas (DIG) or contributions from AGN and post-AGB stars.
Future Work
- Explore the impact of additional physical processes, such as DIG, AGN, and post-AGB stars.
- Investigate the effects of nebular emission contribution from DIG on the N2-BPT offsets.
Paper Details
PDF Preview
Key Terms
Citation Network
Current paper (gray), citations (green), references (blue)
Display is limited for performance on very large graphs.
Similar Papers
Found 4 papersRedshift-dependent galaxy formation efficiency at z=5-13 in the FirstLight simulations
Ralf Klessen, Yurina Nakazato, Daniel Ceverino et al.
| Title | Authors | Year | Actions |
|---|
Comments (0)