Summary
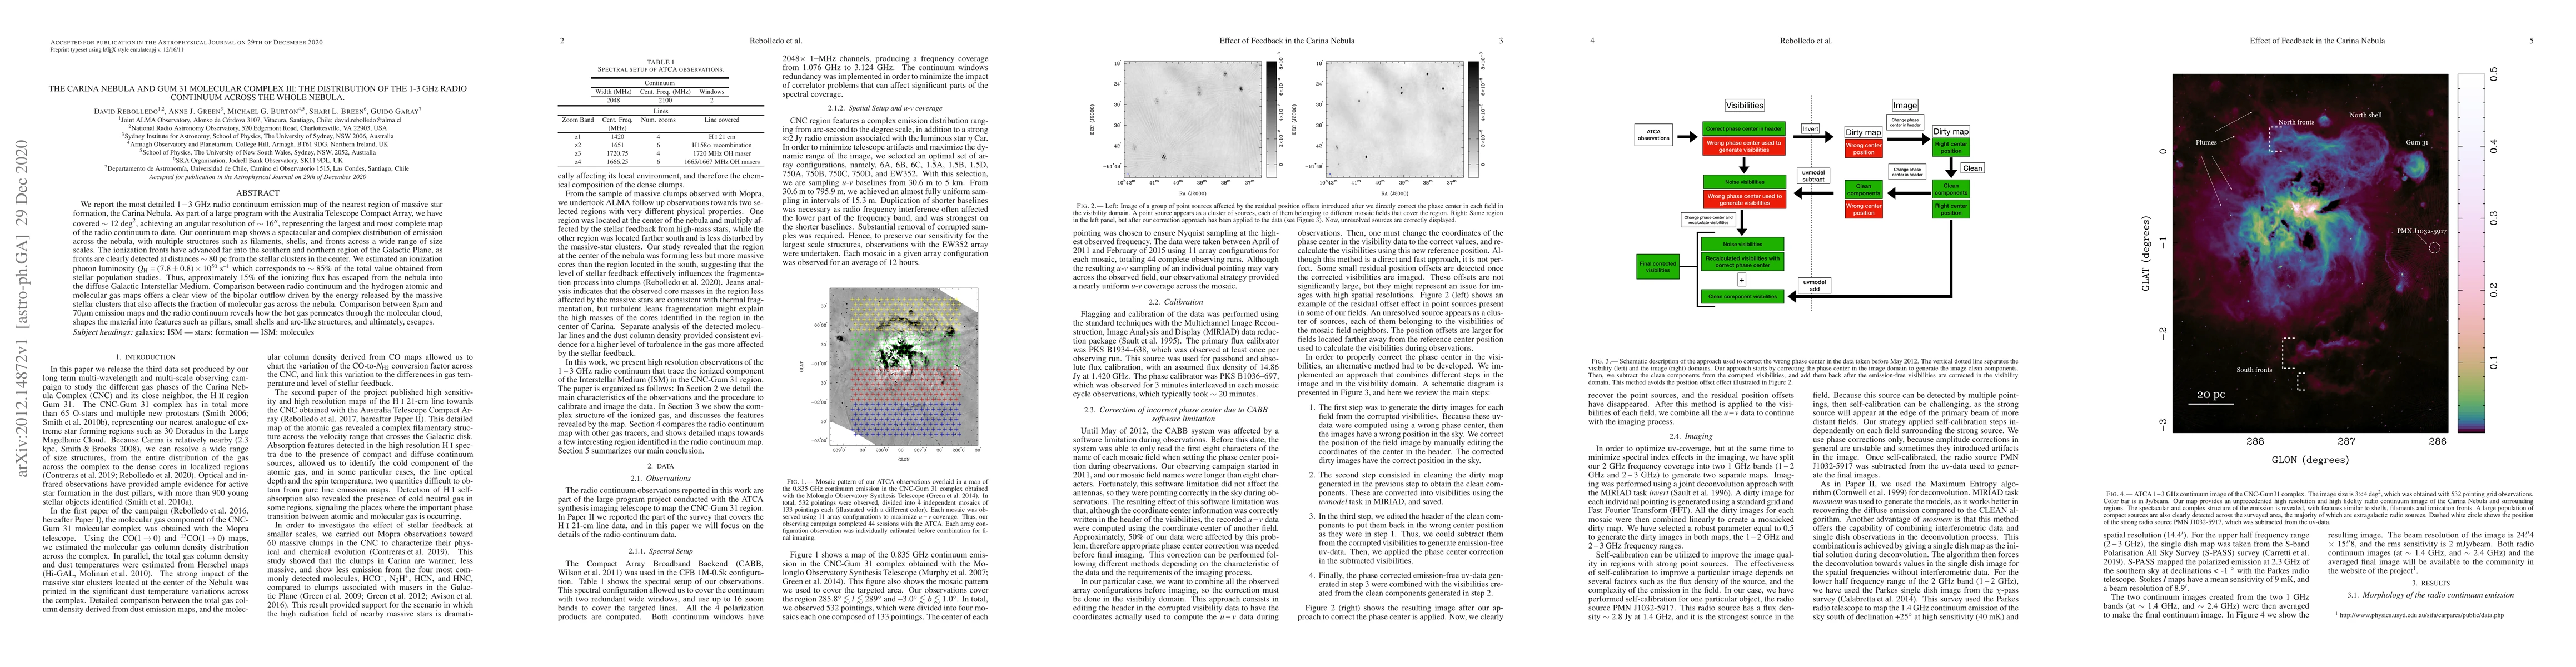
We report the most detailed $1-3$ GHz radio continuum emission map of the nearest region of massive star formation, the Carina Nebula. As part of a large program with the Australia Telescope Compact Array, we have covered $\sim$ 12 deg$^2$, achieving an angular resolution of $\sim$ 16 arcsec, representing the largest and most complete map of the radio continuum to date. Our continuum map shows a spectacular and complex distribution of emission across the nebula, with multiple structures such as filaments, shells, and fronts across a wide range of size scales. The ionization fronts have advanced far into the southern and northern region of the Galactic Plane, as fronts are clearly detected at distances $\sim$ 80 pc from the stellar clusters in the center. We estimated an ionization photon luminosity $Q_\mathrm{H}=(7.8 \pm 0.8) \times 10^{50}$ s$^{-1}$ which corresponds to $\sim 85\%$ of the total value obtained from stellar population studies. Thus, approximately $15\%$ of the ionizing flux has escaped from the nebula into the diffuse Galactic Interstellar Medium. Comparison between radio continuum and the hydrogen atomic and molecular gas maps offers a clear view of the bipolar outflow driven by the energy released by the massive stellar clusters that also affects the fraction of molecular gas across the nebula. Comparison between 8$\mu$m and 70$\mu$m emission maps and the radio continuum reveals how the hot gas permeates through the molecular cloud, shapes the material into features such as pillars, small shells and arc-like structures, and ultimately, escapes.
AI Key Findings
Get AI-generated insights about this paper's methodology, results, and significance.
Paper Details
PDF Preview
Key Terms
Citation Network
Current paper (gray), citations (green), references (blue)
Display is limited for performance on very large graphs.
Similar Papers
Found 4 papers| Title | Authors | Year | Actions |
|---|
Comments (0)