Summary
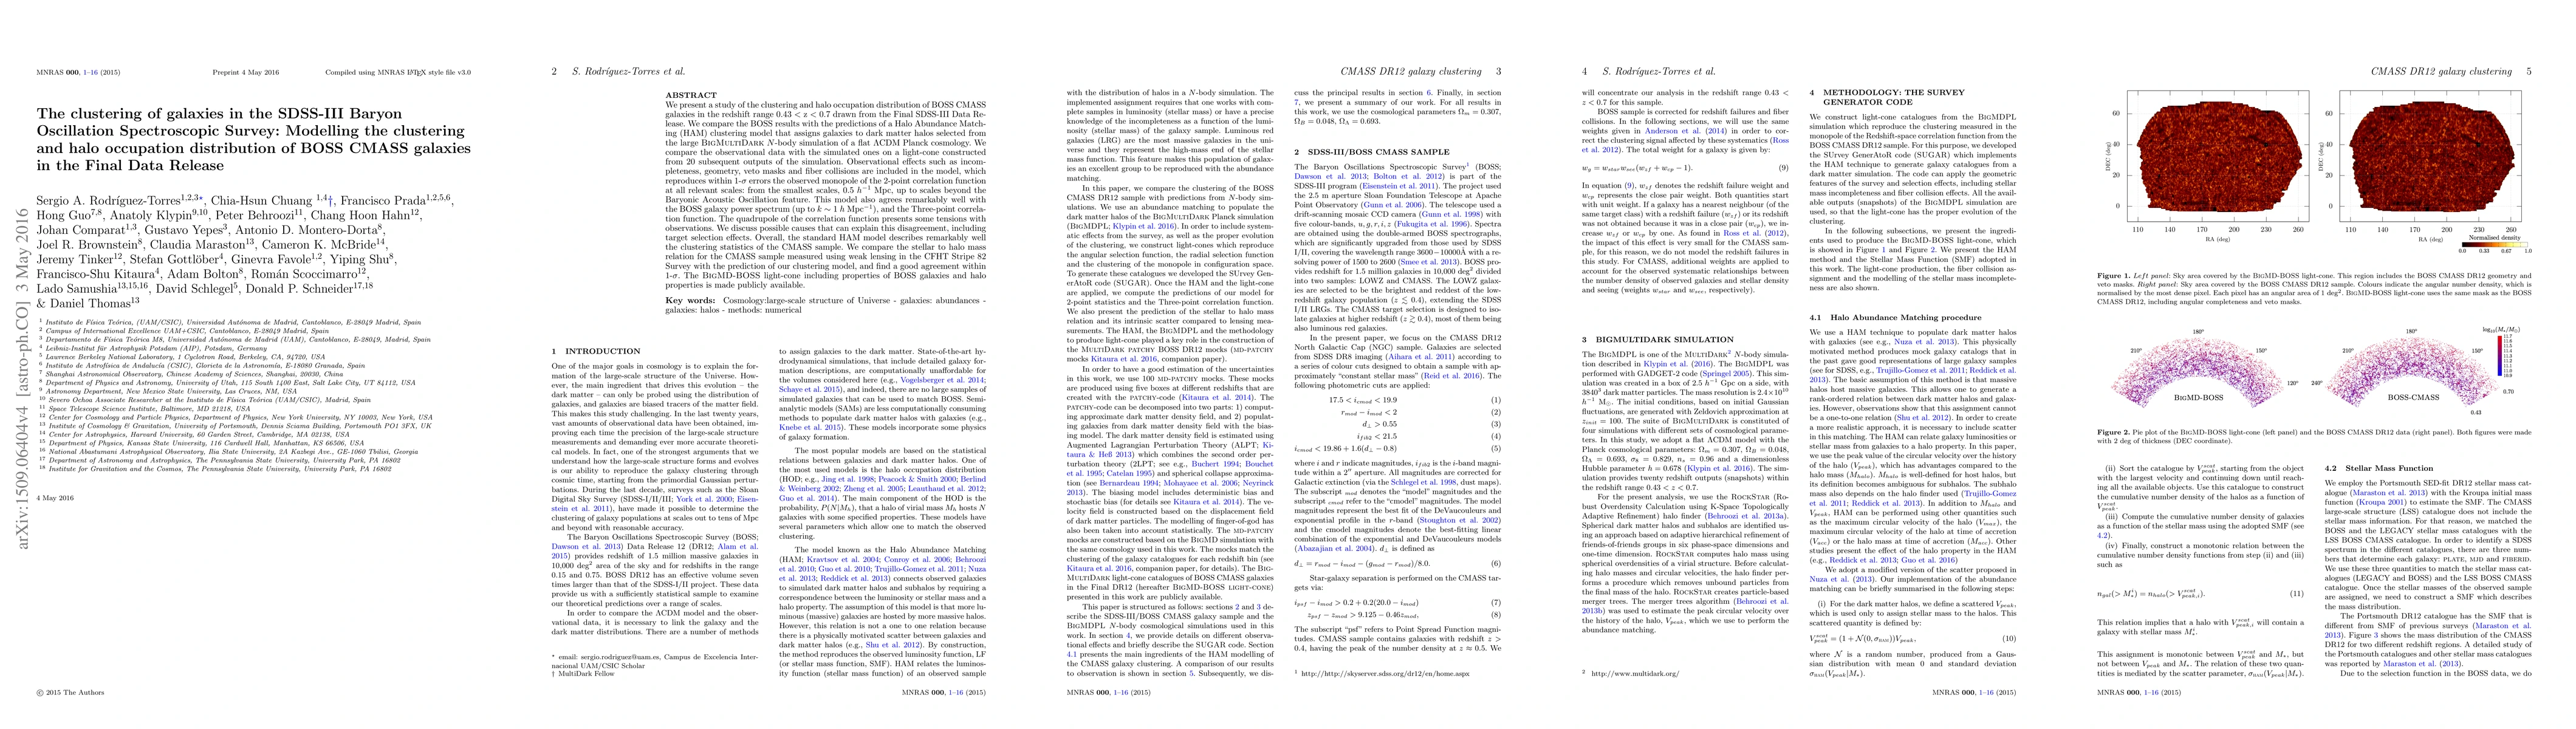
We present a study of the clustering and halo occupation distribution of BOSS CMASS galaxies in the redshift range 0.43 < z < 0.7 drawn from the Final SDSS-III Data Release. We compare the BOSS results with the predictions of a Halo Abundance Matching (HAM) clustering model that assigns galaxies to dark matter halos selected from the large BigMultiDark $N$-body simulation of a flat $\Lambda$CDM Planck cosmology. We compare the observational data with the simulated ones on a light-cone constructed from 20 subsequent outputs of the simulation. Observational effects such as incompleteness, geometry, veto masks and fiber collisions are included in the model, which reproduces within 1-$\sigma$ errors the observed monopole of the 2-point correlation function at all relevant scales: from the smallest scales, 0.5 $h^{-1}$ Mpc, up to scales beyond the Baryonic Acoustic Oscillation feature. This model also agrees remarkably well with the BOSS galaxy power spectrum (up to $k\sim1$ $h$ Mpc$^{-1}$), and the Three-point correlation function. The quadrupole of the correlation function presents some tensions with observations. We discuss possible causes that can explain this disagreement, including target selection effects. Overall, the standard HAM model describes remarkably well the clustering statistics of the CMASS sample. We compare the stellar to halo mass relation for the CMASS sample measured using weak lensing in the CFHT Stripe 82 Survey with the prediction of our clustering model, and find a good agreement within 1-$\sigma$. The BigMD-BOSS light-cone including properties of BOSS galaxies and halo properties is made publicly available.
AI Key Findings
Get AI-generated insights about this paper's methodology, results, and significance.
Paper Details
PDF Preview
Key Terms
Citation Network
Current paper (gray), citations (green), references (blue)
Display is limited for performance on very large graphs.
Similar Papers
Found 4 papers| Title | Authors | Year | Actions |
|---|
Comments (0)