01
MethodologyHow they did it
The research used a combination of simulations and observations to study the distribution of galaxy halos.
The research used a combination of simulations and observations to study the distribution of galaxy halos. More in Methodology →
The simulation results showed a strong bias towards large halo masses. — The observational data confirmed this bias, with a significant correlation between halo mass and galaxy properties. More in Key Results →
This research has important implications for our understanding of galaxy evolution and the distribution of matter in the universe. More in Significance →
The simulations were limited by their resolution and numerical accuracy. — The observational data were subject to selection effects and biases. More in Limitations →
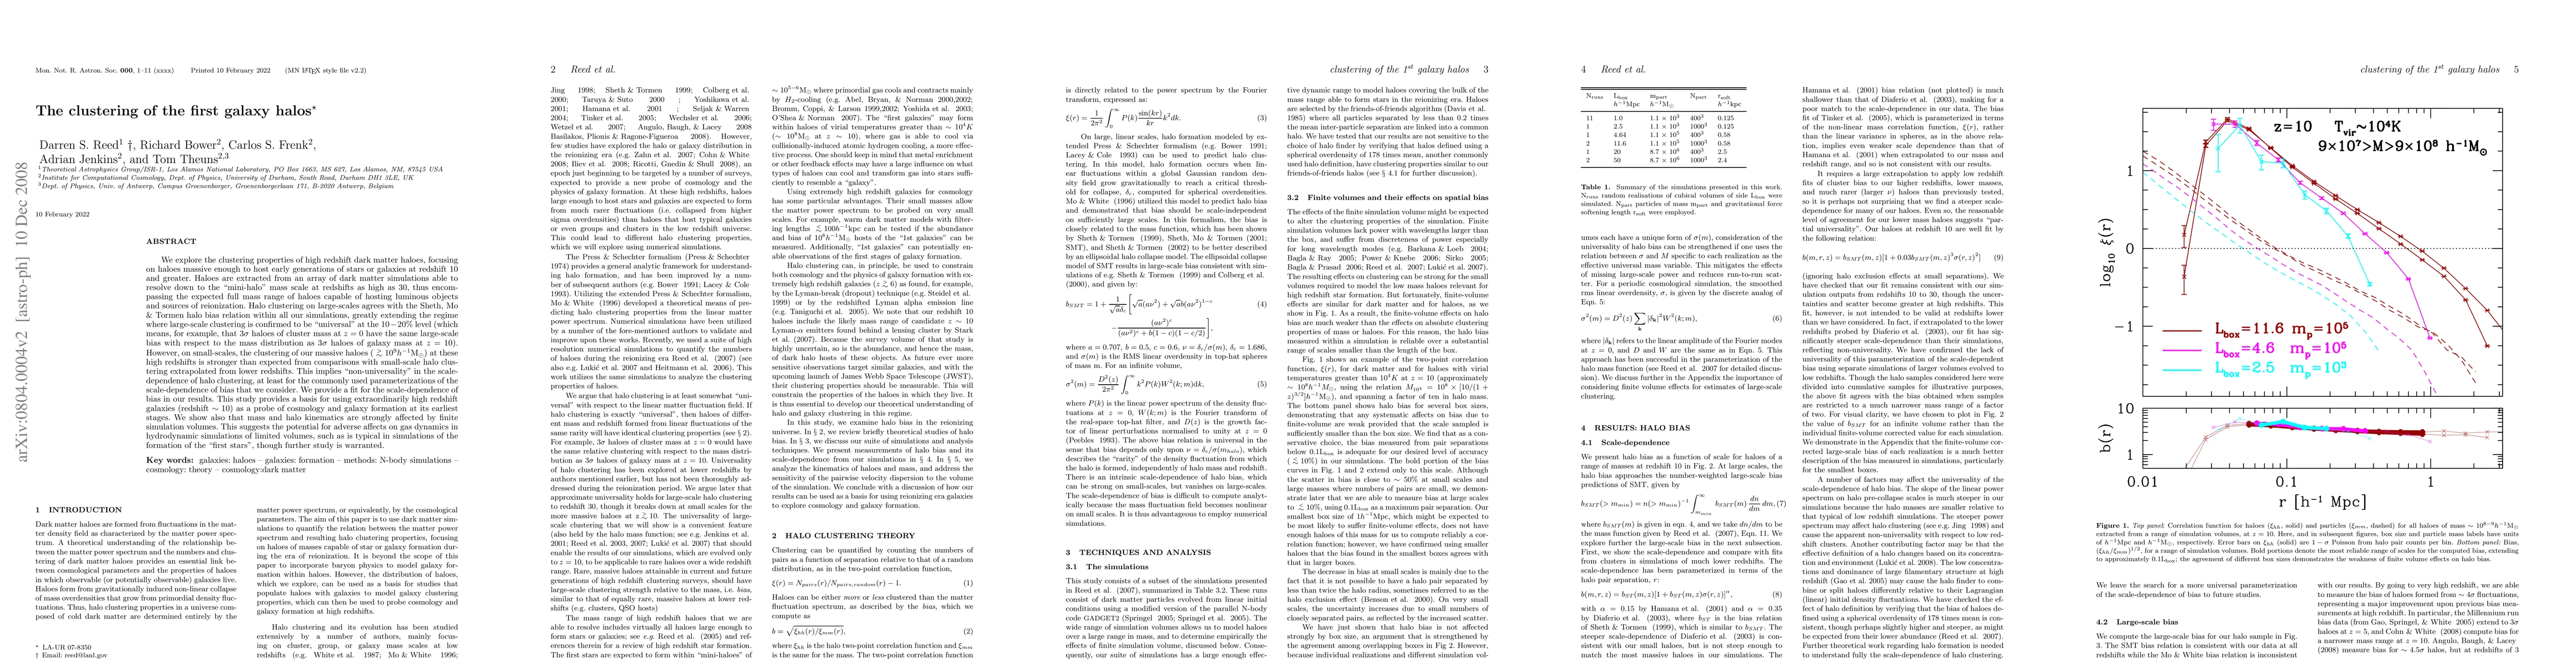
We explore the clustering properties of high redshift dark matter halos, focusing on halos massive enough to host early generations of stars or galaxies at redshift 10 and greater. Halos are extracted from an array of dark matter simulations able to resolve down to the "mini-halo" mass scale at redshifts as high as 30, thus encompassing the expected full mass range of halos capable of hosting luminous objects and sources of reionization. Halo clustering on large-scales agrees with the Sheth, Mo & Tormen halo bias relation within all our simulations, greatly extending the regime where large-scale clustering is confirmed to be "universal" at the 10-20% level (which means, for example, that 3sigma halos of cluster mass at z=0 have the same large-scale bias with respect to the mass distribution as 3sigma halos of galaxy mass at z=10). However, on small-scales, the clustering of our massive halos (> ~10^9 Msun/h) at these high redshifts is stronger than expected from comparisons with small-scale halo clustering extrapolated from lower redshifts. This implies "non-universality" in the scale-dependence of halo clustering, at least for the commonly used parameterizations of the scale-dependence of bias that we consider. We provide a fit for the scale-dependence of bias in our results. This study provides a basis for using extraordinarily high redshift galaxies (redshift ~10) as a probe of cosmology and galaxy formation at its earliest stages. We show also that mass and halo kinematics are strongly affected by finite simulation volumes. This suggests the potential for adverse affects on gas dynamics in hydrodynamic simulations of limited volumes, such as is typical in simulations of the formation of the "first stars", though further study is warranted.
Seven facets of this paper, analysed and brought into focus by AI.
This research has important implications for our understanding of galaxy evolution and the distribution of matter in the universe.
The research used a combination of simulations and observations to study the distribution of galaxy halos.
This research has important implications for our understanding of galaxy evolution and the distribution of matter in the universe.
The development of a new algorithm for simulating galaxy formation in large-scale structure models.
This research presents a novel approach to studying the distribution of galaxy halos, combining simulations with observational data to constrain theoretical models.
Current paper (gray), citations (green), references (blue)
Display is limited for performance on very large graphs.
Discussion 0