01
MethodologyHow they did it
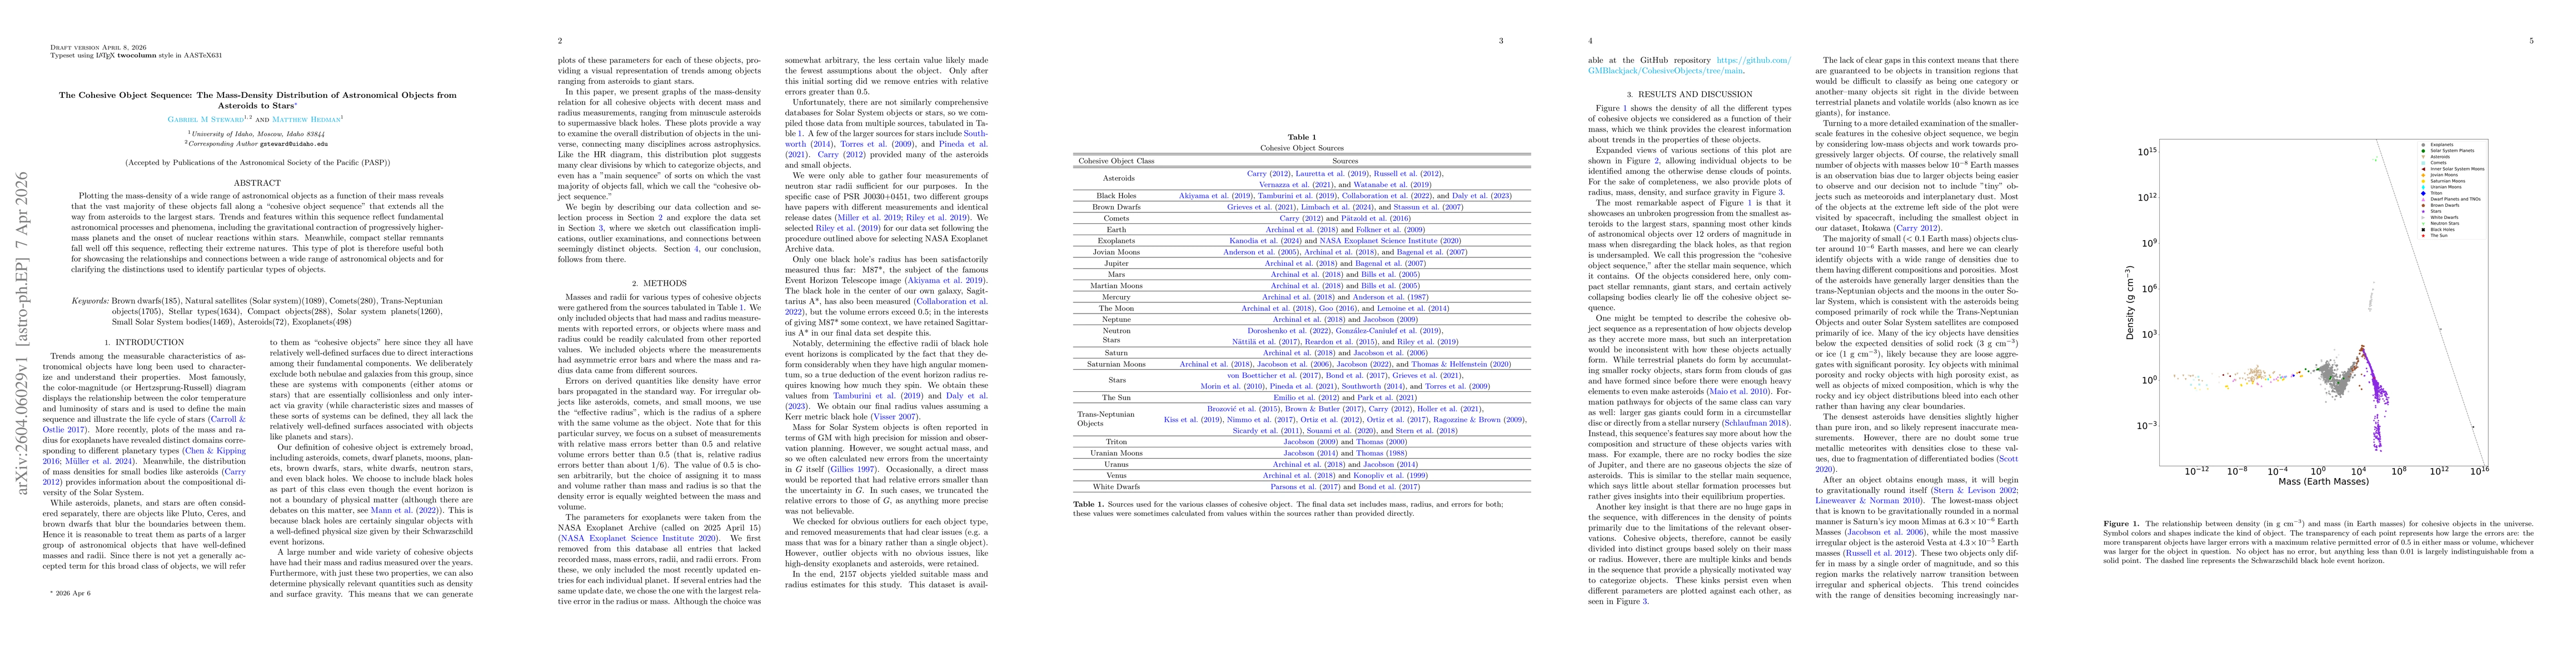
Compiled a dataset of 2157 cohesive astronomical objects from multiple catalogs (exoplanets, Solar System bodies, stars, compact remnants) and plotted mass–density, radius–density, and surface gravity relationships, using transparency to encode measurement uncertainties.
Discussion 0