Authors
Summary
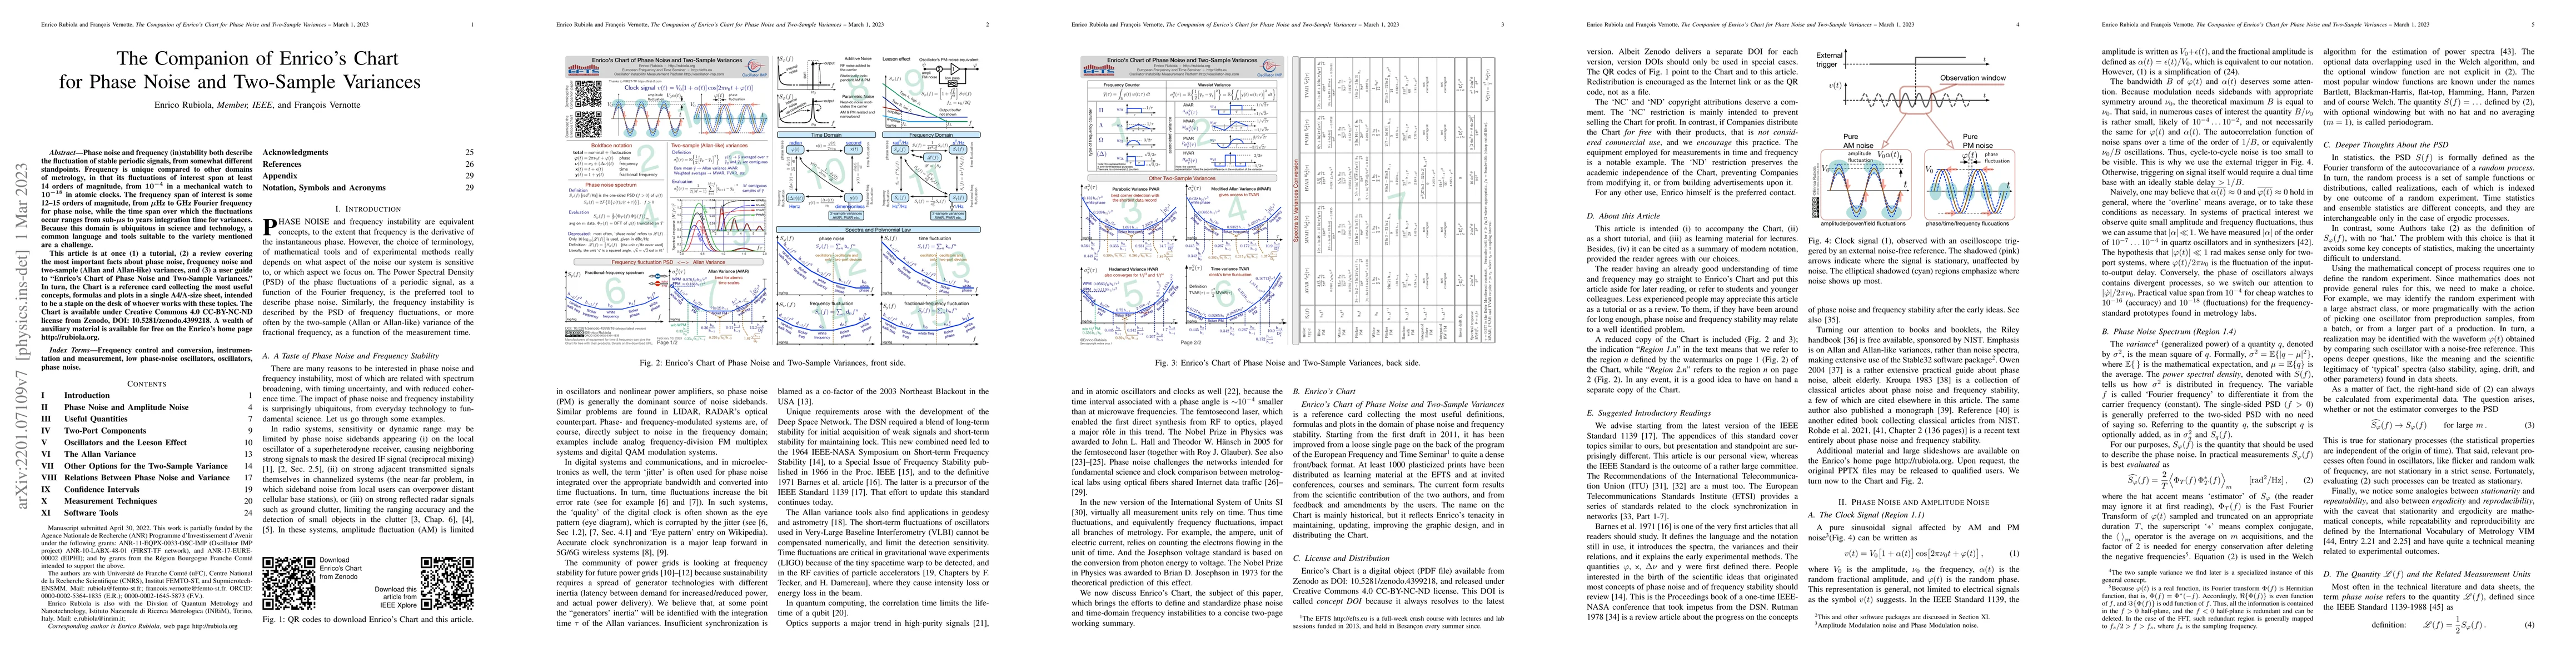
Phase noise and frequency (in)stability both describe the fluctuation of stable periodic signals, from somewhat different standpoints. Frequency is unique compared to other domains of metrology, in that its fluctuations of interest span at least 14 orders of magnitude, from $10^{-4}$ in a mechanical watch to $10^{-18}$ in atomic clocks. The frequency span of interest is some 12-15 orders of magnitude, from $\mu$Hz to GHz Fourier frequency for phase noise, while the time span over which the fluctuations occur ranges from sub-$\mu$s to years integration time for variances. Because this domain is ubiquitous in science and technology, a common language and tools suitable to the variety mentioned are a challenge. This article is at once (1) a tutorial, (2) a review covering the most important facts about phase noise, frequency noise and two-sample (Allan and Allan-like) variances, and (3) a user guide to "Enrico's Chart of Phase Noise and Two-Sample Variances." In turn, the Chart is a reference card collecting the most useful concepts, formulas and plots in a single A4/A-size sheet, intended to be a staple on the desk of whoever works with these topics. The Chart is available under Creative Commons 4.0 CC-BY-NC-ND license from Zenodo, DOI 10.5281/zenodo.4399218. A wealth of auxiliary material is available for free on the Enrico's home page http://rubiola.org.
AI Key Findings
Get AI-generated insights about this paper's methodology, results, and significance.
Paper Details
PDF Preview
Key Terms
Citation Network
Current paper (gray), citations (green), references (blue)
Display is limited for performance on very large graphs.
Similar Papers
Found 4 papers| Title | Authors | Year | Actions |
|---|
Comments (0)