Publication
Metrics
Paper Preview
Abstract
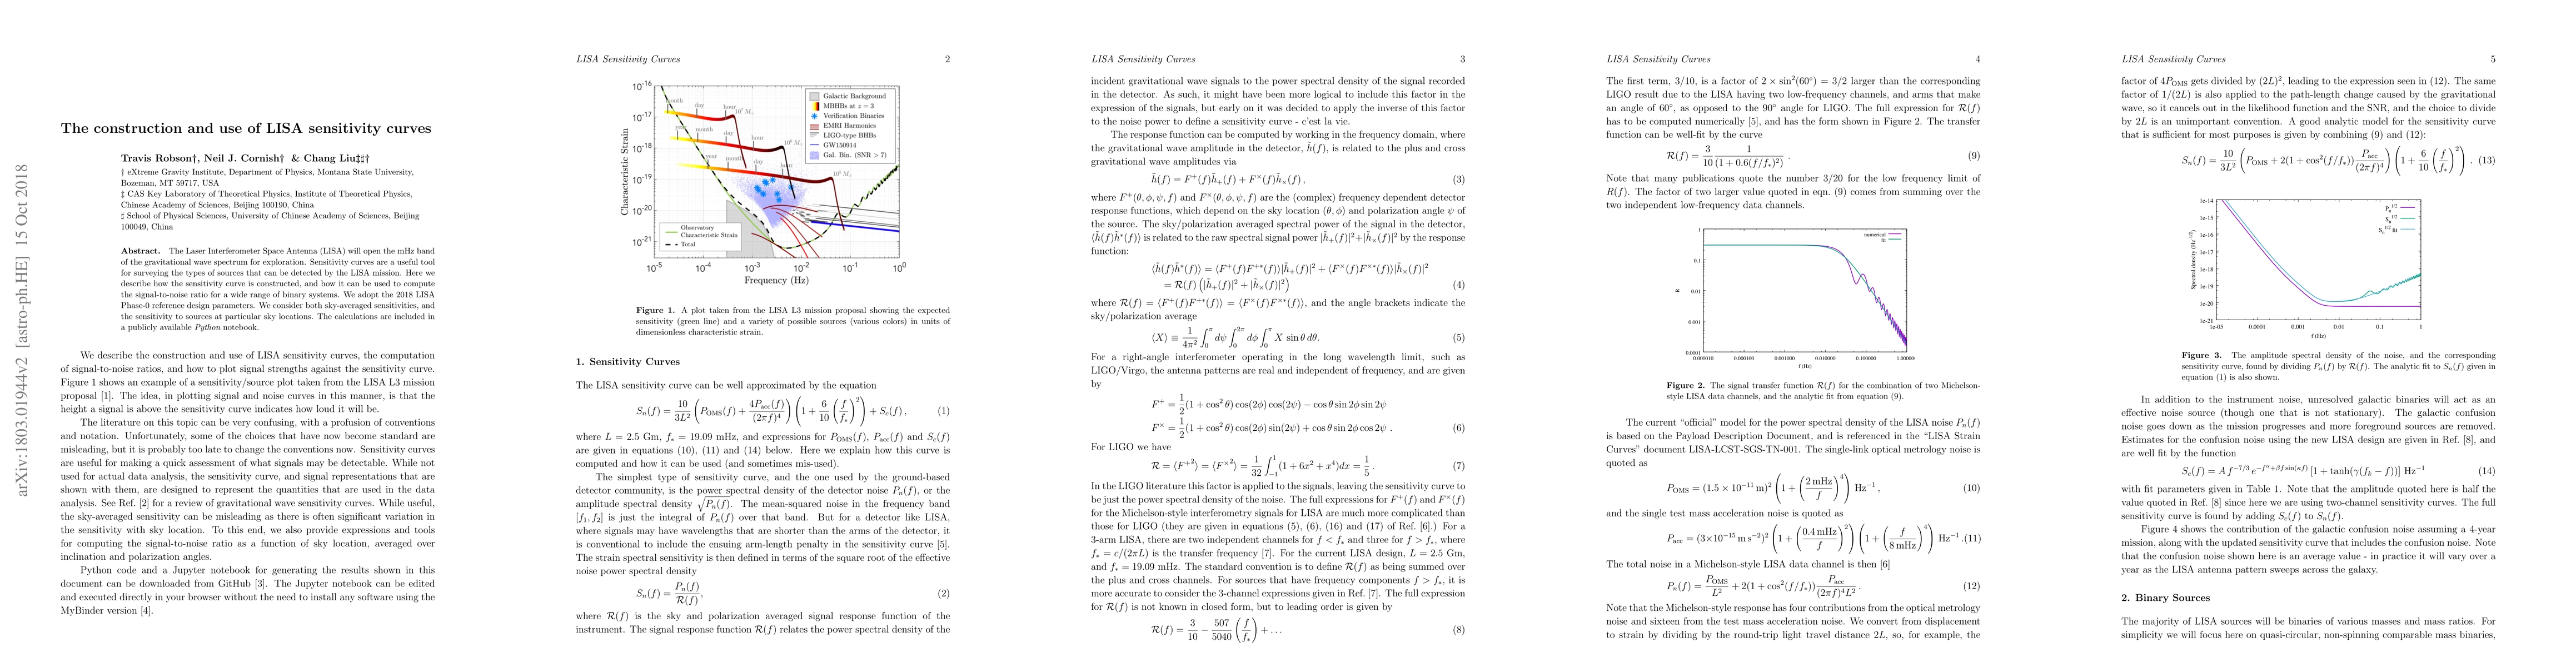
The Laser Interferometer Space Antenna (LISA) will open the mHz band of the gravitational wave spectrum for exploration. Sensitivity curves are a useful tool for surveying the types of sources that can be detected by the LISA mission. Here we describe how the sensitivity curve is constructed, and how it can be used to compute the signal-to-noise ratio for a wide range of binary systems. We adopt the 2018 LISA Phase-0 reference design parameters. We consider both sky-averaged sensitivities, and the sensitivity to sources at particular sky locations. The calculations are included in a publicly available {\em Python} notebook.
AI Key Findings
Get AI-generated insights about this paper's methodology, results, significance, and more — seven facets brought into focus.
Impact
Paper Details
PDF Preview
Key Terms
Citation Network
Current paper (gray), citations (green), references (blue)
Display is limited for performance on very large graphs.
Discussion 0