Background
Correspondence Analysis (CA) provides a principled way to embed cross-tabulation data (observations crossed with attributes) into a Euclidean factor space using the chi-squared metric. The method yields a unified representation of observations and attributes, enabling visualization of complex interrelationships and their evolution. The framework also introduces a topology of information through hierarchy, where ultrametric distances capture dissimilarity in a way that highlights anomalies and novel structure. The literature cited anchors CA as a robust tool for data coding and semantic analysis, and the paper extends CA to a platform that blends spatial embedding with hierarchical, sequential analysis.
Problem / Research Question
The central challenge is to model two complementary aspects of information semantics in a unified way: (i) the total network of interrelationships among observations and attributes, and (ii) the detection of anomaly and change as data evolve, including sequential ordering such as time. The question is how to embed diverse information spaces into a common, interpretable space and then extract meaningful hierarchical structure that reflects narrative flow or policy evolution, while enabling the projection of new or supplementary data.
Innovation / Contribution
The paper presents a general semantic-analysis platform that couples: (a) a Euclidean embedding of cross-tabulation data via CA, enabling visualization and interpretation of the web of interrelationships; and (b) an induced ultrametric to model sequential or hierarchical structure, capturing novelty and change over time. The innovations include information-space fusion (barycentric projections), the use of supplementary elements to project new attributes without re-running the core CA, and a sequence-constrained complete-link hierarchical clustering that respects the order of observations. The approach is demonstrated on Casablanca’s narrative analysis and applied to policy decision-making data, illustrating how CA-based mappings can drive strategy by focusing on key themes, temporal dynamics, and organizational clusters.
Methodology / Approach
The analysis proceeds as follows: begin with a contingency table (e.g., scenes by attributes or proposals by themes). Endow this table with the chi-squared metric and perform CA to map observations and attributes into a common Euclidean factor space. The coordinates Fα(i) on each factor α place each observation i in the plane of principal inertia. Supplementary elements (observations or attributes given zero mass) can be projected post hoc using barycentric transition formulas, enabling flexible fusion of information spaces.
Next, perform hierarchical clustering in the Euclidean factor space. The clustering is sequence-constrained: only adjacent segments in the original order (e.g., consecutive scenes or consecutive proposals) can be merged, producing a complete-link agglomeration with a non-decreasing proximity criterion. The resulting ultrametric encodes hierarchical structure tied to the sequence, highlighting caesuras, breakpoints, and changes in the flow of information or narrative.
Finally, interpret the results through projections onto the factors, inspection of the ultrametric structure for anomaly, and Monte Carlo tests that compare observed patterns to randomized baselines. The Appendix formalizes the analysis chain, input/output mappings, and the geometry of the information spaces.
Experiments / Evaluation
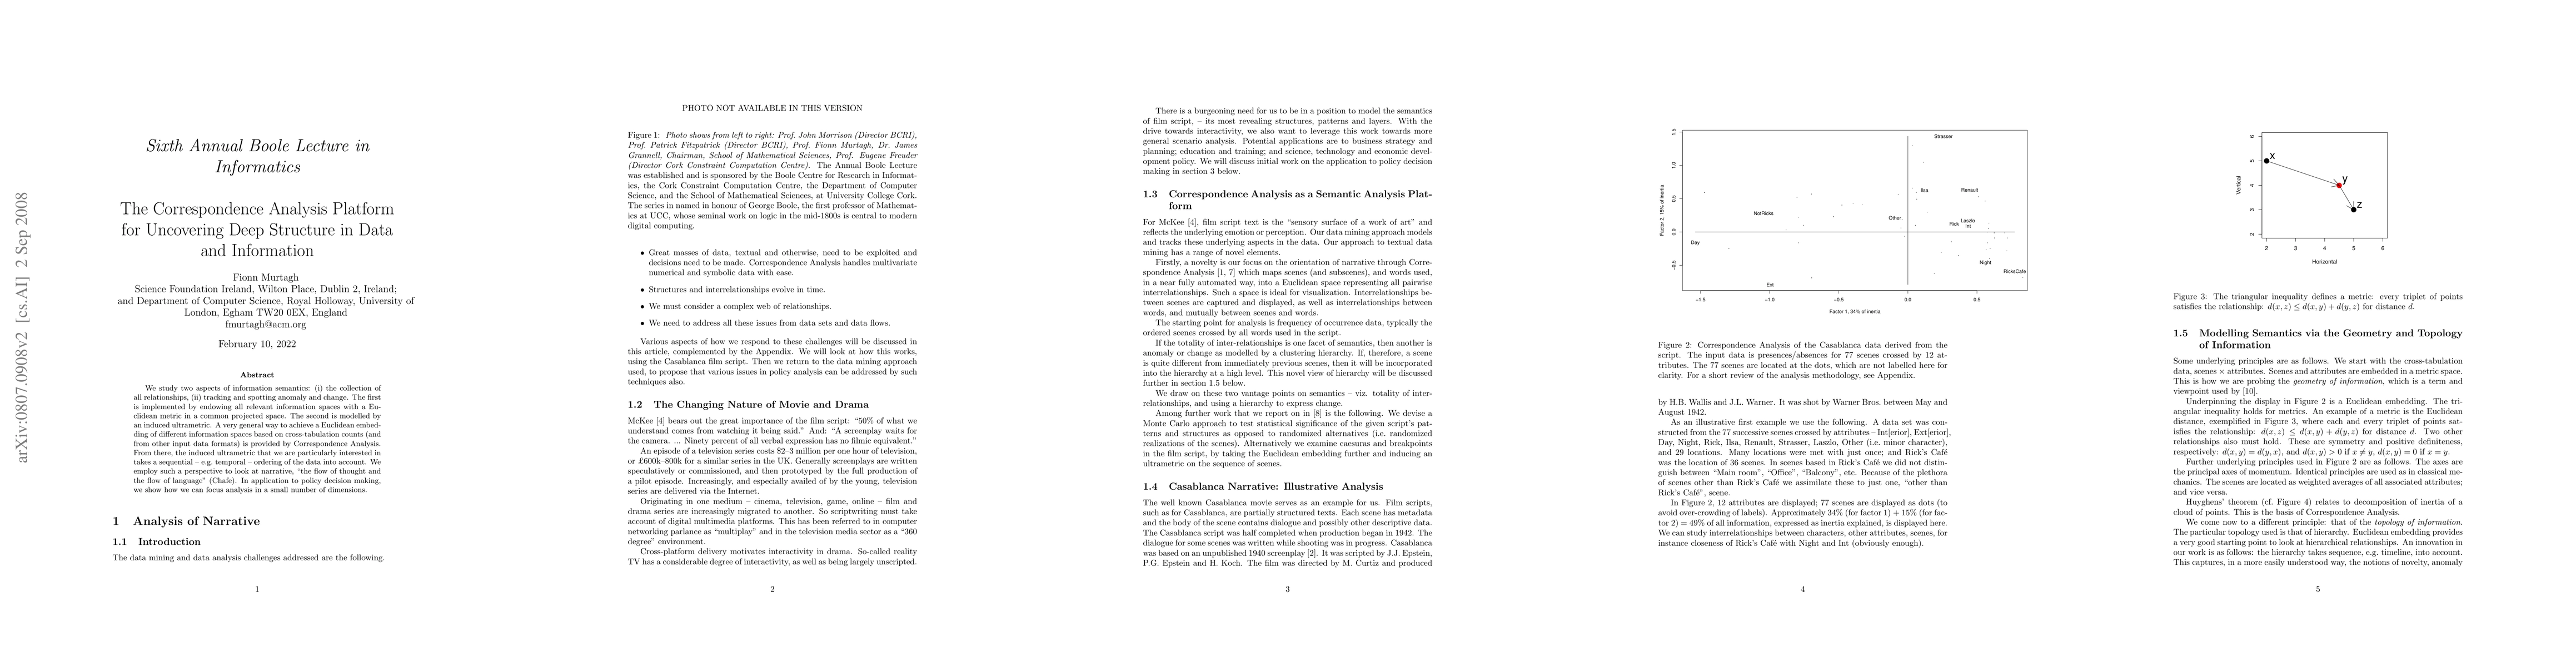
The Casablanca narrative serves as an illustrative test: 77 successive scenes cross-tabulated with 12 attributes yield a rich factor-space representation. In the two-dimensional principal plane, approximately 49% of the total inertia is captured (34% by factor 1 and 15% by factor 2), allowing meaningful visualization of scene-word and scene-attribute interrelationships. Scene 43, subdivided into 11 beats, is analyzed with full-dimensional input; the evolution from beat to beat shows a caesura between beats 7 and 8, consistent with McKee’s narrative shifts, and the subsequent hierarchical clustering (Figure 9) reveals how beats group under sequence constraints.
In a policy context, the platform is applied to cross-tabulated data for eight CSETs and twelve SRCs by themes, budgets, and personnel metrics. The planar display explains 93% of inertia when projecting into the major thematic space (factor 1 and factor 2), enabling a high-utility visualization of how themes, budgets, and institutes relate. Figures 10–14 illustrate how CSETs, subthemes, budgets, and SRCs map onto the same planar space, facilitating direct cross-comparison and interpretation across multiple dimensions of policy data.
Key Results
The study demonstrates that a CA-based Euclidean embedding, when augmented with a sequence-aware ultrametric, yields a coherent and interpretable representation of complex narratives and policy data. The method captures substantial information content in low-dimensional displays, while the sequence-constrained clustering reveals meaningful change points and hierarchical groupings aligned with domain knowledge (e.g., beats in a scene or clusters of bioscience-focused themes in policy data). The projection of supplementary elements allows new data to be integrated without distorting the established geometry, enhancing the platform’s utility for iterative analysis and large-scale information fusion.
Practical Applications
This platform provides a general, practitioner-friendly toolkit for narrative analytics and policy support. It enables analysts to: map and compare large, heterogeneous datasets (scenes, attributes, themes, budgets) in a common space; detect periods or observations that stand out as anomalous or novel; identify sequence-driven clusters and caesuras to guide qualitative follow-up; and support strategic decision-making by tracing the evolution of themes and relationships over time. The methodology is applicable beyond film scripts to any domain with cross-tabulated data and a need to understand both the full network of relationships and their temporal development (e.g., research funding, program evaluation, or complex narrative datasets).
Limitations & Considerations
The planar embeddings are approximations of higher-dimensional structure, so important information may lie beyond the 2D view. The approach relies on cross-tabulation and the chi-squared metric; sparse data or missing values may distort distances, and the choice of masses can influence results. The sequence constraint, while valuable for preserving natural order, may constrain discovery of non-sequential relationships. Ultrametric interpretation assumes hierarchical structure that may not capture all types of change. Finally, scalability to very large matrices and streaming data remains an open practical challenge, requiring careful optimization or approximate CA variants. These limitations point to important directions for further validation, scalability testing, and comparative benchmarking against alternative embedding and clustering methods.
Discussion 0