The Cross-Quantilogram: Measuring Quantile Dependence and Testing Directional Predictability between Time Series
Publication
Metrics
AI Quick Summary
This paper introduces the cross-quantilogram to measure quantile dependence between time series and tests directional predictability. It provides a robust statistical framework with consistent confidence intervals and simulation studies, demonstrating its application in stock market predictability and systemic risk analysis.
Paper Preview
Abstract
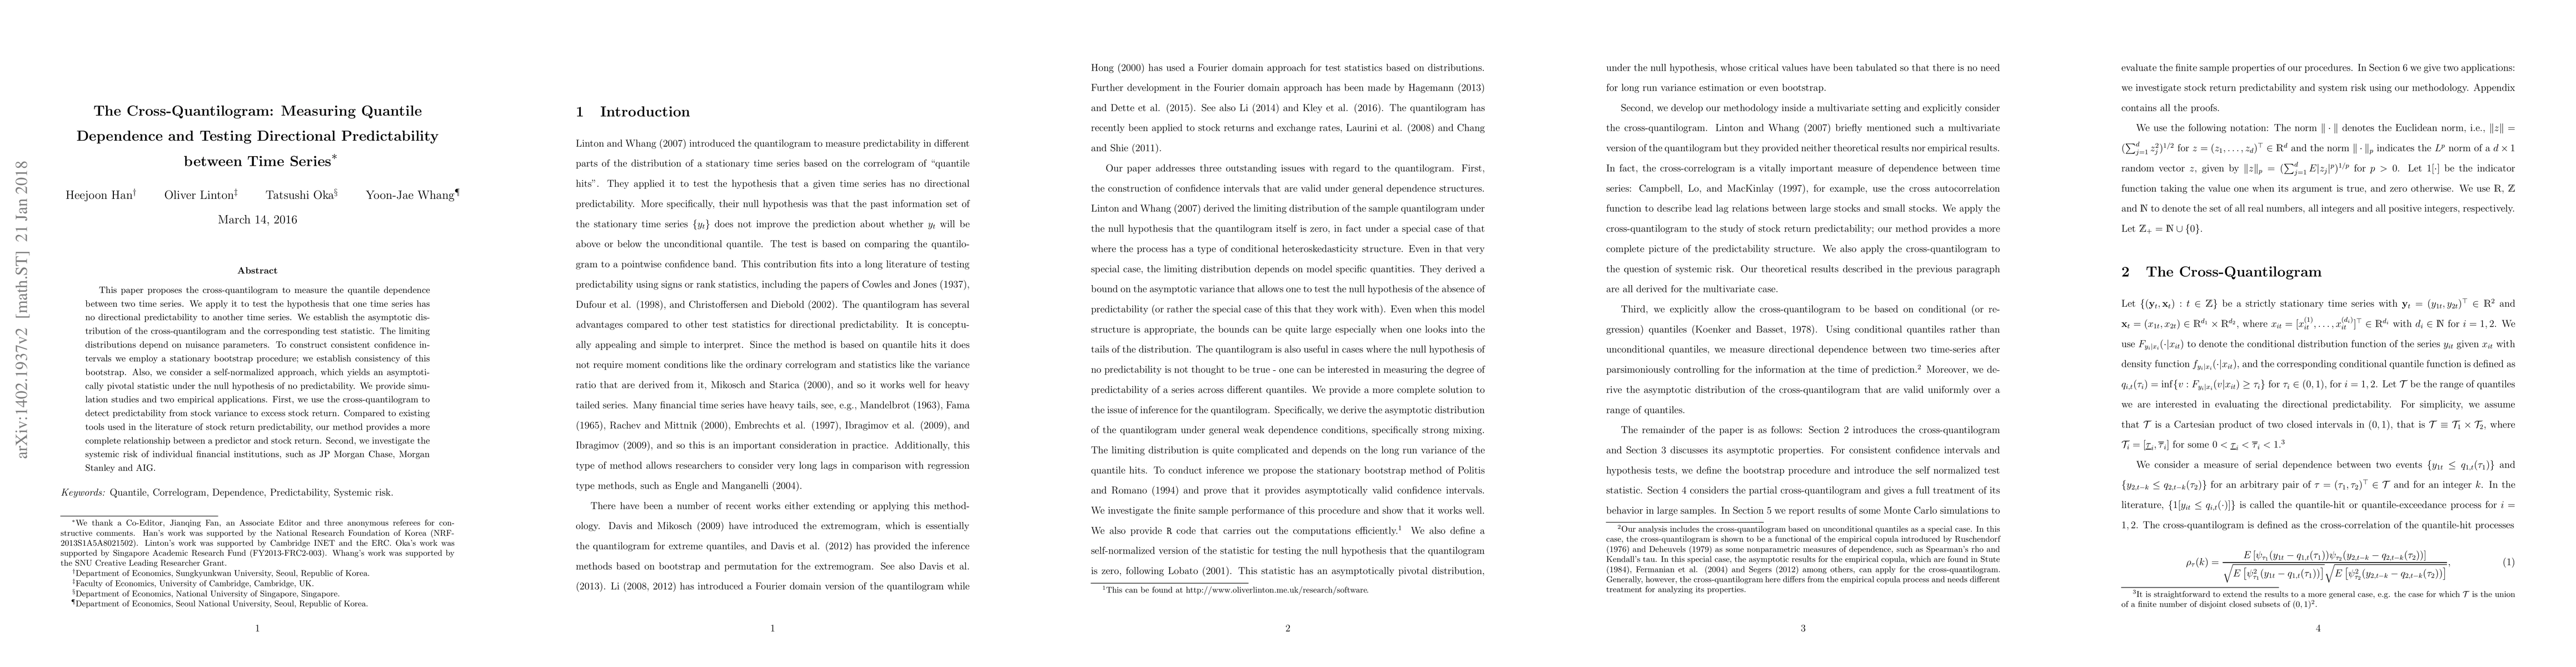
This paper proposes the cross-quantilogram to measure the quantile dependence between two time series. We apply it to test the hypothesis that one time series has no directional predictability to another time series. We establish the asymptotic distribution of the cross quantilogram and the corresponding test statistic. The limiting distributions depend on nuisance parameters. To construct consistent confidence intervals we employ the stationary bootstrap procedure; we show the consistency of this bootstrap. Also, we consider the self-normalized approach, which is shown to be asymptotically pivotal under the null hypothesis of no predictability. We provide simulation studies and two empirical applications. First, we use the cross-quantilogram to detect predictability from stock variance to excess stock return. Compared to existing tools used in the literature of stock return predictability, our method provides a more complete relationship between a predictor and stock return. Second, we investigate the systemic risk of individual financial institutions, such as JP Morgan Chase, Goldman Sachs and AIG. This article has supplementary materials online.
AI Key Findings
Get AI-generated insights about this paper's methodology, results, significance, and more — seven facets brought into focus.
Impact
Paper Details
PDF Preview
Key Terms
Citation Network
Current paper (gray), citations (green), references (blue)
Display is limited for performance on very large graphs.
Discussion 0