Authors
Summary
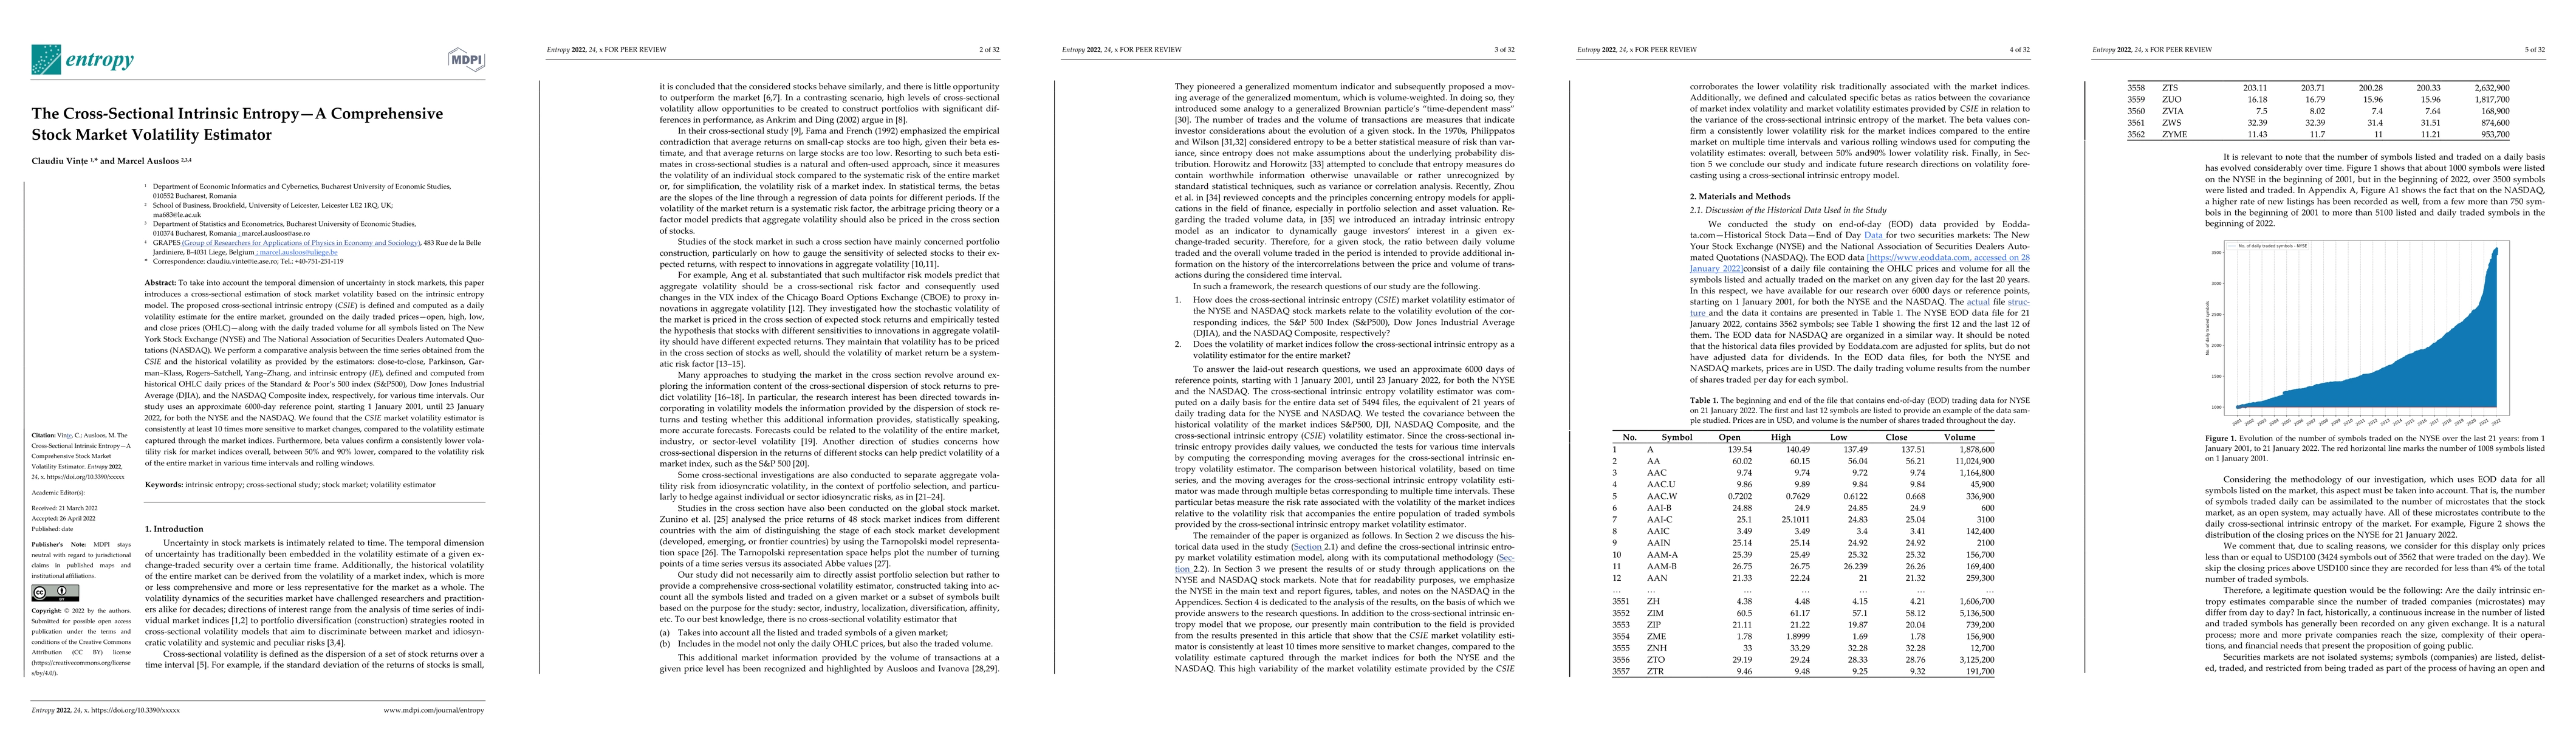
To take into account the temporal dimension of uncertainty in stock markets, this paper introduces a cross-sectional estimation of stock market volatility based on the intrinsic entropy model. The proposed cross-sectional intrinsic entropy (CSIE) is defined and computed as a daily volatility estimate for the entire market, grounded on the daily traded prices: open, high, low, and close prices (OHLC), along with the daily traded volume for all symbols listed on The New York Stock Exchange (NYSE) and The National Association of Securities Dealers Automated Quotations (NASDAQ). We perform a comparative analysis between the time series obtained from the CSIE and the historical volatility as provided by the estimators: close-to-close, Parkinson, Garman-Klass, Rogers-Satchell, Yang-Zhang, and intrinsic entropy (IE), defined and computed from historical OHLC daily prices of the Standard & Poor's 500 index (S&P500), Dow Jones Industrial Average (DJIA), and the NASDAQ Composite index, respectively, for various time intervals. Our study uses approximately 6000 day reference points, starting on 1 Jan. 2001, until 23 Jan. 2022, for both the NYSE and the NASDAQ. We found that the CSIE market volatility estimator is consistently at least 10 times more sensitive to market changes, compared to the volatility estimate captured through the market indices. Furthermore, beta values confirm a consistently lower volatility risk for market indices overall, between 50% and 90% lower, compared to the volatility risk of the entire market in various time intervals and rolling windows.
AI Key Findings
Get AI-generated insights about this paper's methodology, results, and significance.
Paper Details
PDF Preview
Key Terms
Citation Network
Current paper (gray), citations (green), references (blue)
Display is limited for performance on very large graphs.
Similar Papers
Found 4 papersPortfolio Volatility Estimation Relative to Stock Market Cross-Sectional Intrinsic Entropy
Marcel Ausloos, Claudiu Vinte
A Volatility Estimator of Stock Market Indices Based on the Intrinsic Entropy Model
Marcel Ausloos, Claudiu Vinte, Titus Felix Furtuna
| Title | Authors | Year | Actions |
|---|
Comments (0)