Summary
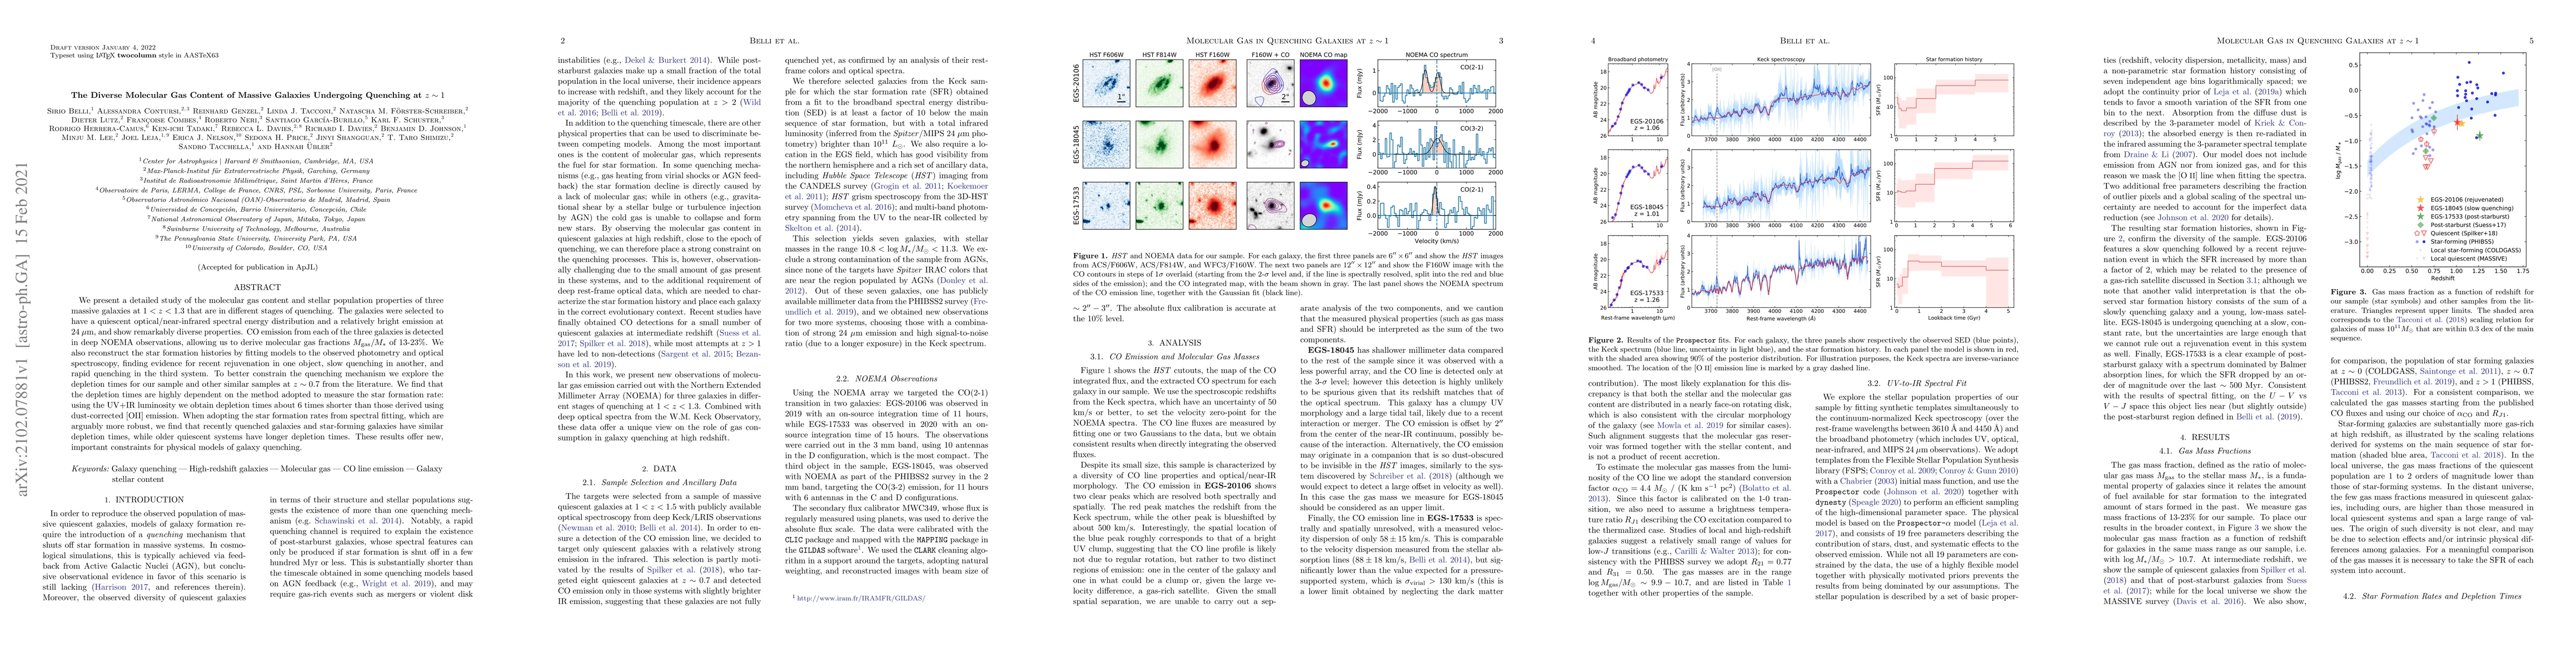
We present a detailed study of the molecular gas content and stellar population properties of three massive galaxies at 1 < z < 1.3 that are in different stages of quenching. The galaxies were selected to have a quiescent optical/near-infrared spectral energy distribution and a relatively bright emission at 24 micron, and show remarkably diverse properties. CO emission from each of the three galaxies is detected in deep NOEMA observations, allowing us to derive molecular gas fractions Mgas/Mstar of 13-23%. We also reconstruct the star formation histories by fitting models to the observed photometry and optical spectroscopy, finding evidence for recent rejuvenation in one object, slow quenching in another, and rapid quenching in the third system. To better constrain the quenching mechanism we explore the depletion times for our sample and other similar samples at z~0.7 from the literature. We find that the depletion times are highly dependent on the method adopted to measure the star formation rate: using the UV+IR luminosity we obtain depletion times about 6 times shorter than those derived using dust-corrected [OII] emission. When adopting the star formation rates from spectral fitting, which are arguably more robust, we find that recently quenched galaxies and star-forming galaxies have similar depletion times, while older quiescent systems have longer depletion times. These results offer new, important constraints for physical models of galaxy quenching.
AI Key Findings
Get AI-generated insights about this paper's methodology, results, and significance.
Paper Details
PDF Preview
Key Terms
Citation Network
Current paper (gray), citations (green), references (blue)
Display is limited for performance on very large graphs.
Similar Papers
Found 4 papers| Title | Authors | Year | Actions |
|---|
Comments (0)