Publication
Metrics
AI Quick Summary
This paper presents a dust emission map of the starless core TMC-1C at various wavelengths, finding a dust emissivity spectral index close to the assumed value of beta = 2. The study also maps the dust temperature and column density, revealing a line-of-sight-averaged temperature of ~7 K at the dust peak.
Paper Preview
Abstract
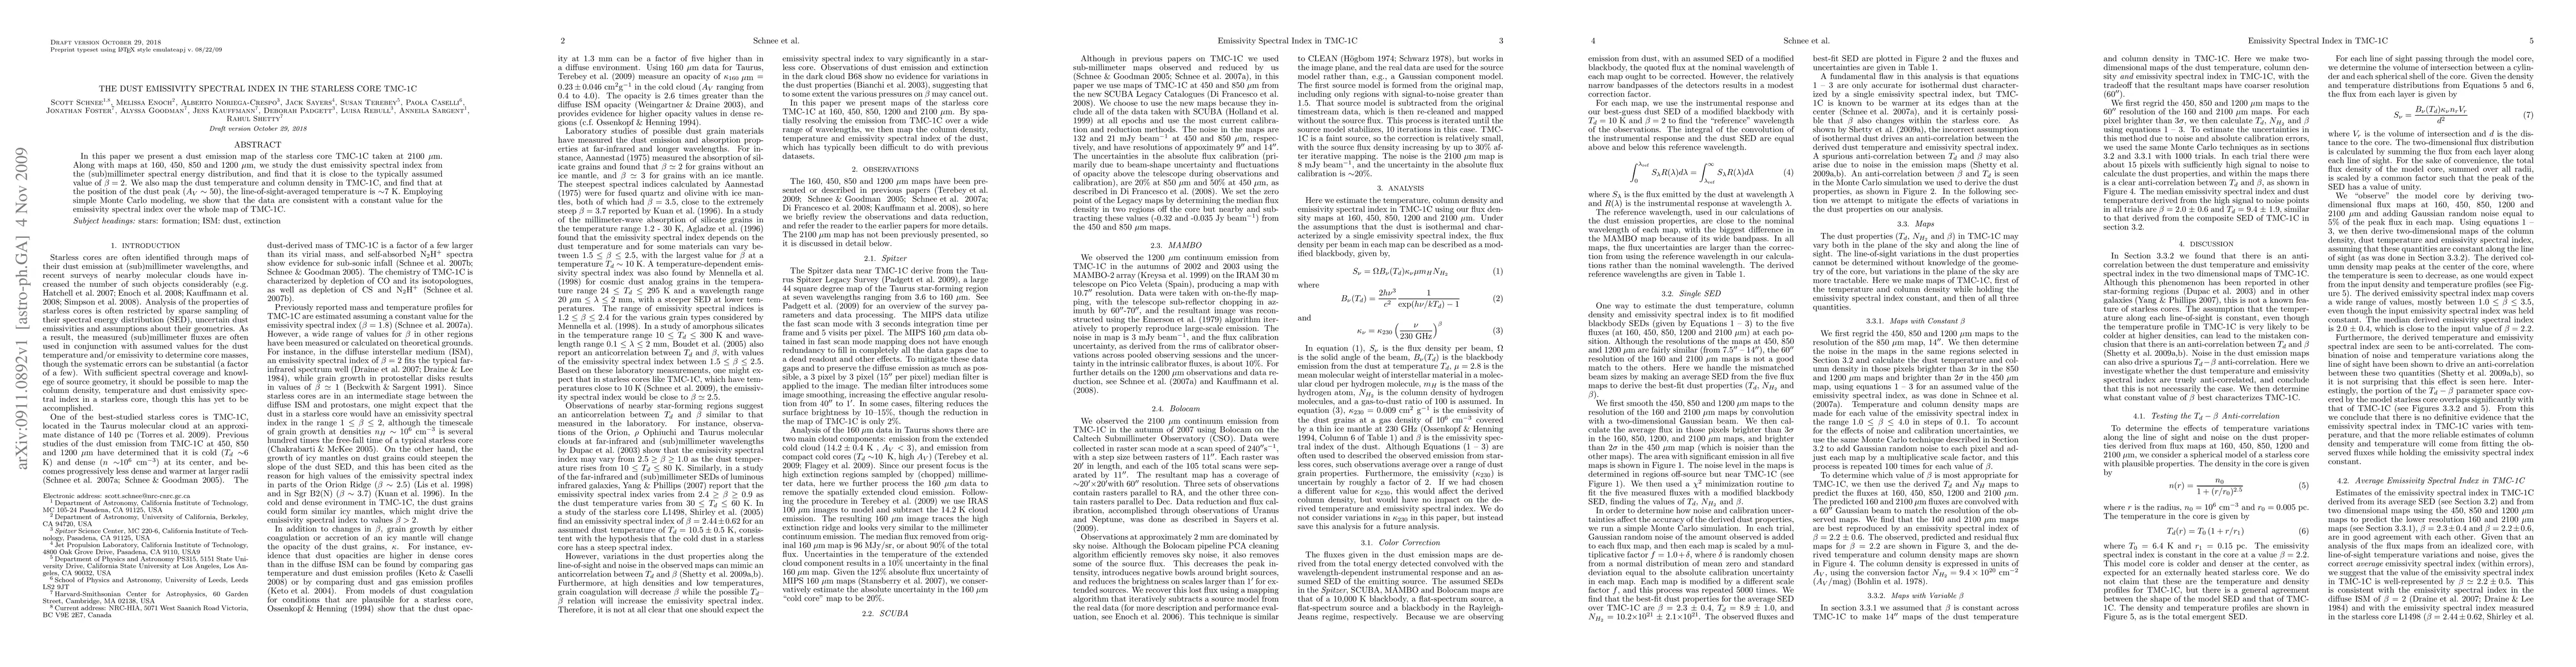
In this paper we present a dust emission map of the starless core TMC-1C taken at 2100 microns. Along with maps at 160, 450, 850 and 1200 microns, we study the dust emissivity spectral index from the (sub)millimeter spectral energy distribution, and find that it is close to the typically assumed value of beta = 2. We also map the dust temperature and column density in TMC-1C, and find that at the position of the dust peak (A_V ~ 50), the line-of-sight-averaged temperature is ~7 K. Employing simple Monte Carlo modeling, we show that the data are consistent with a constant value for the emissivity spectral index over the whole map of TMC-1C.
AI Key Findings
Get AI-generated insights about this paper's methodology, results, significance, and more — seven facets brought into focus.
Impact
Paper Details
PDF Preview
Key Terms
Citation Network
Current paper (gray), citations (green), references (blue)
Display is limited for performance on very large graphs.
Discussion 0