Summary
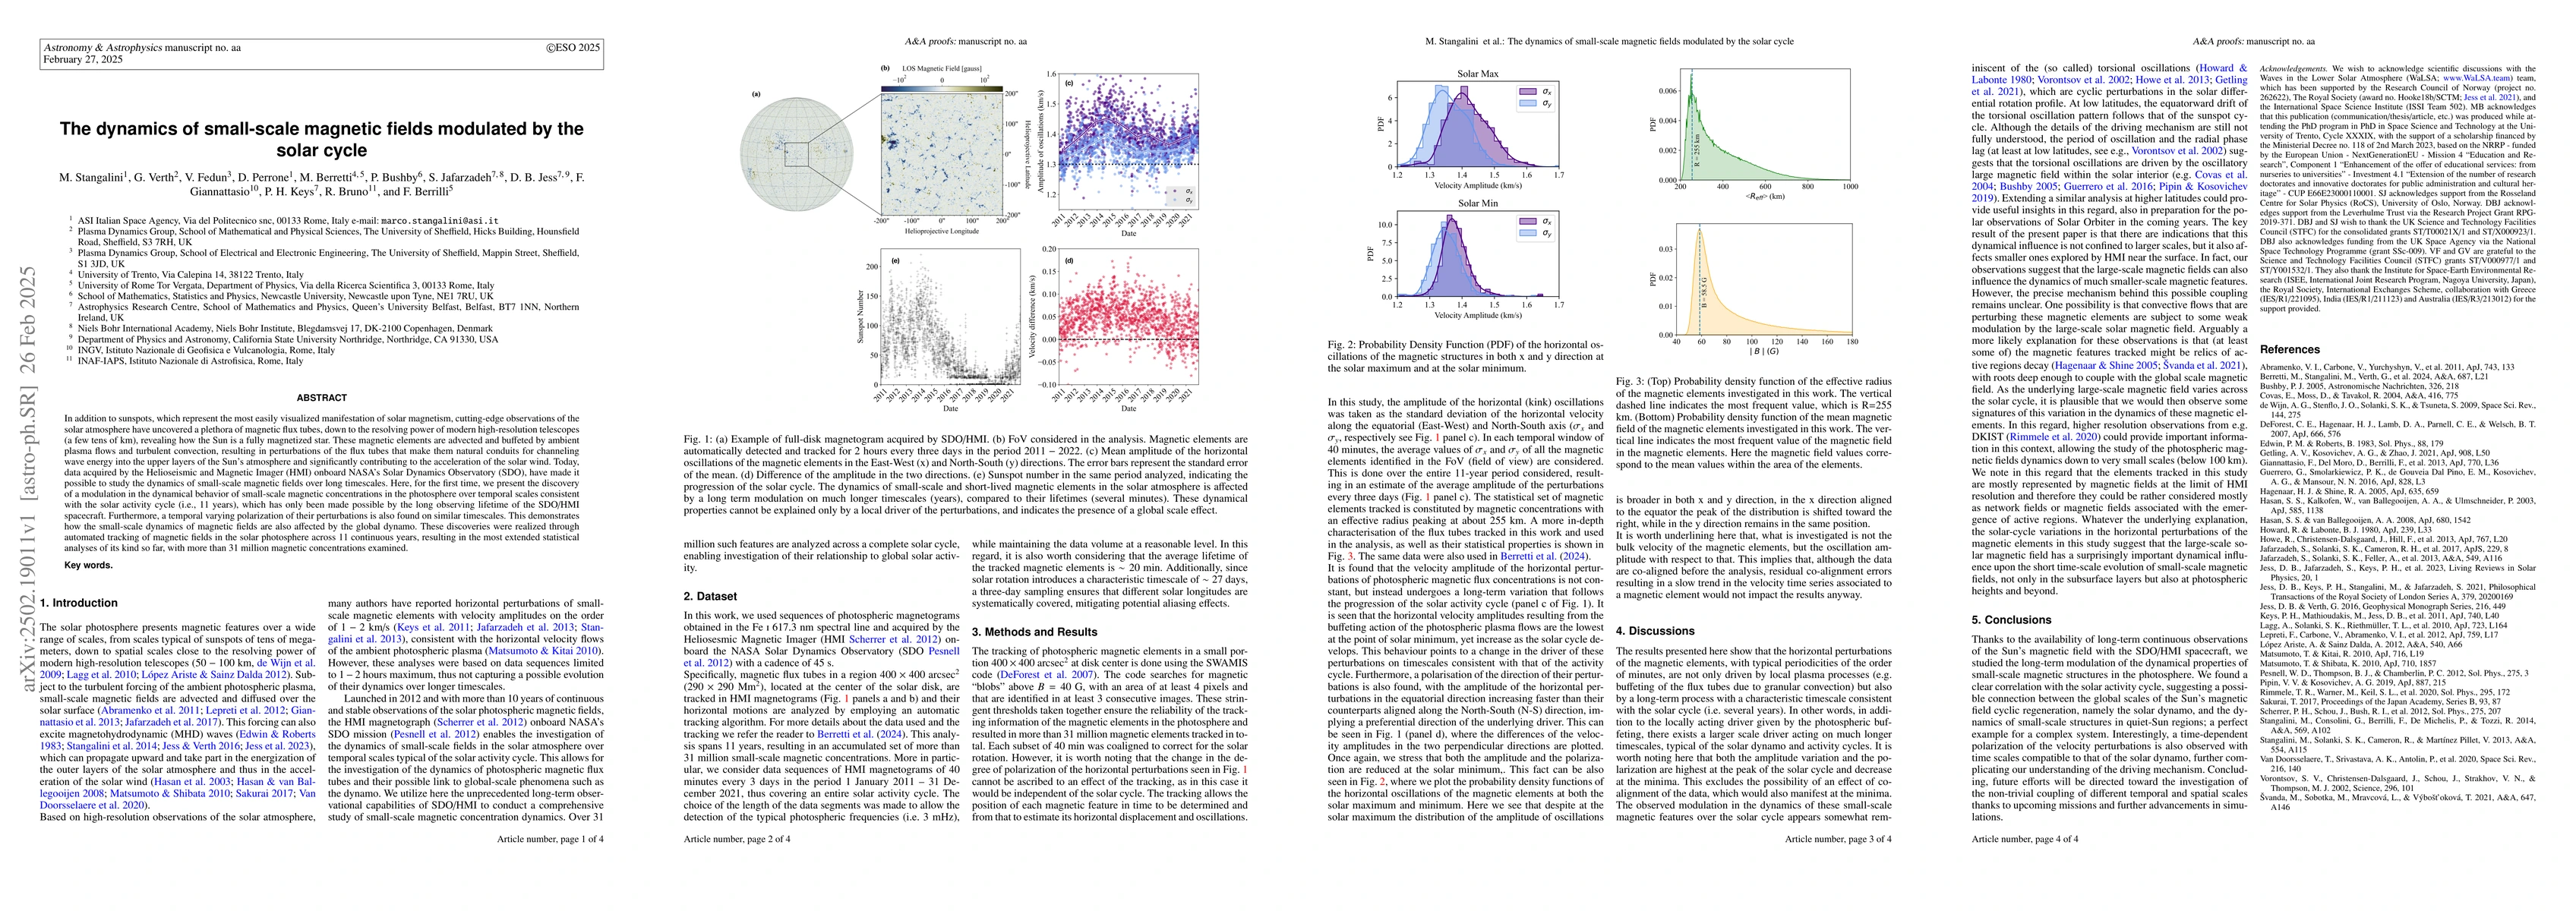
In addition to sunspots, which represent the most easily visualized manifestation of solar magnetism, cutting-edge observations of the solar atmosphere have uncovered a plethora of magnetic flux tubes, down to the resolving power of modern high-resolution telescopes (a few tens of km), revealing how the Sun is a fully magnetized star. These magnetic elements are advected and buffeted by ambient plasma flows and turbulent convection, resulting in perturbations of the flux tubes that make them natural conduits for channeling wave energy into the upper layers of the Sun's atmosphere and significantly contributing to the acceleration of the solar wind. Today, data acquired by the Helioseismic and Magnetic Imager (HMI) onboard NASA's Solar Dynamics Observatory (SDO), have made it possible to study the dynamics of small-scale magnetic fields over long timescales. Here, for the first time, we present the discovery of a modulation in the dynamical behavior of small-scale magnetic concentrations in the photosphere over temporal scales consistent with the solar activity cycle (i.e. 11 years), which has only been made possible by the long observing lifetime of the SDO/HMI spacecraft. Furthermore, a temporal varying polarization of their perturbations is also found on similar timescales. This demonstrates how the small-scale dynamics of magnetic fields are also affected by the global dynamo. These discoveries were realized through automated tracking of magnetic fields in the solar photosphere across 11 continuous years, resulting in the most extended statistical analyses of its kind so far, with more than 31 million magnetic concentrations examined.
AI Key Findings
Generated Jun 11, 2025
Methodology
The study utilized sequences of photospheric magnetograms from the Helioseismic and Magnetic Imager (HMI) onboard NASA's Solar Dynamics Observatory (SDO), tracking magnetic flux tubes in a 400x400 arcsec² region at the center of the solar disk for over 11 years. Automated tracking algorithms were employed to analyze the horizontal motions of these magnetic elements, resulting in an accumulated set of over 31 million small-scale magnetic concentrations.
Key Results
- Discovery of a modulation in the dynamical behavior of small-scale magnetic concentrations in the photosphere over temporal scales consistent with the solar activity cycle (11 years).
- Finding of a temporal varying polarization of their perturbations on similar timescales, demonstrating that small-scale dynamics of magnetic fields are also affected by the global dynamo.
- Revealed that the velocity amplitude of horizontal perturbations of photospheric magnetic flux concentrations varies along with the solar activity cycle.
Significance
This research is significant as it provides insights into the influence of large-scale solar magnetic fields on the short-time scale evolution of small-scale magnetic fields, not only in subsurface layers but also at photospheric heights and beyond, highlighting the complex interplay between different scales in solar magnetism.
Technical Contribution
The paper presents an extensive statistical analysis of small-scale magnetic concentrations in the solar photosphere over an entire solar cycle, leveraging the long-term observational capabilities of SDO/HMI.
Novelty
This work is novel in demonstrating a clear correlation between the dynamics of small-scale magnetic structures in the photosphere and the solar activity cycle, revealing a long-term variation in the amplitude of horizontal perturbations of these magnetic features that aligns with the solar cycle's progression.
Limitations
- The study focused on a specific region (400x400 arcsec² at disk center) and might not be representative of the entire solar surface.
- The analysis was based on magnetograms with a spatial resolution of ~1 arcsec, which might not capture all the fine details of small-scale magnetic features.
Future Work
- Extending the analysis to higher latitudes to understand the influence of the solar dynamo on small-scale magnetic features in different regions of the Sun.
- Utilizing higher resolution observations from upcoming missions like DKIST to study the dynamics of photospheric magnetic fields down to very small scales (below 100 km).
Paper Details
PDF Preview
Similar Papers
Found 4 papersInteraction of convective plasma and small-scale magnetic fields in the lower solar atmosphere
Santiago Vargas Domínguez, Dominik Utz
No citations found for this paper.

Comments (0)