Publication
Metrics
AI Quick Summary
US metropolitan areas show higher economic complexity in larger cities and Northeast regions, with traded industries being more complex than local-serving ones. Regions with high complexity tend to have higher income per capita but were also more affected by the financial crisis.
Paper Preview
Abstract
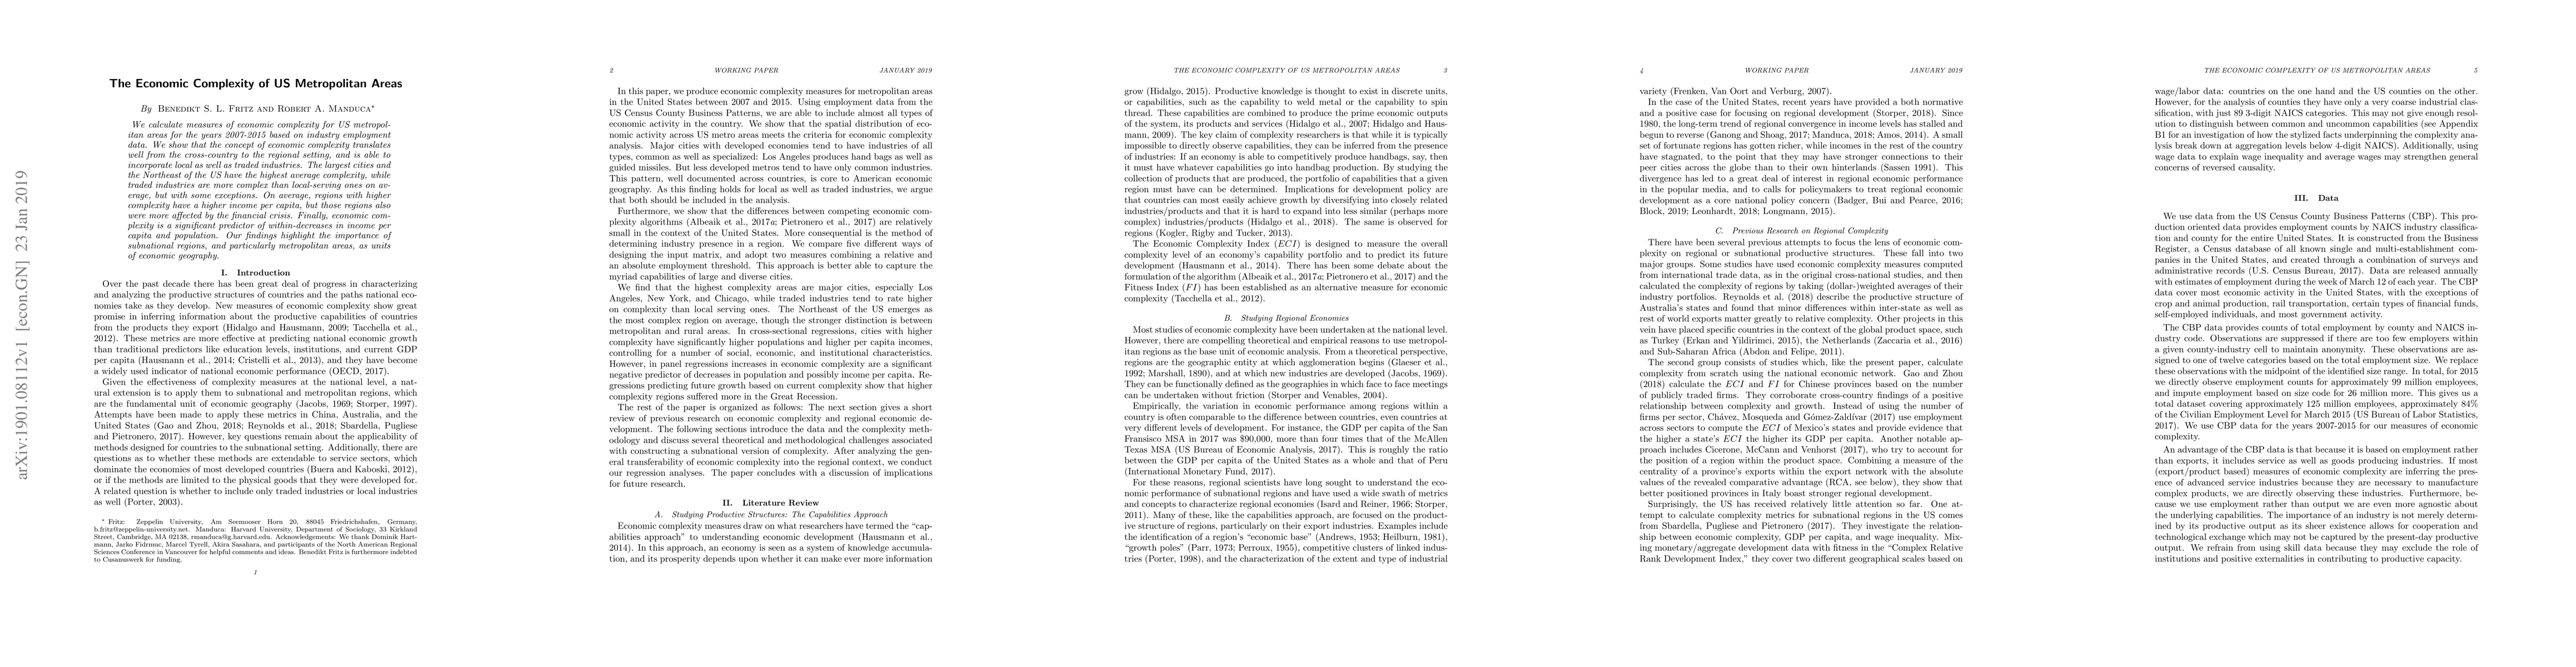
We calculate measures of economic complexity for US metropolitan areas for the years 2007-2015 based on industry employment data. We show that the concept of economic complexity translates well from the cross-country to the regional setting, and is able to incorporate local as well as traded industries. The largest cities and the Northeast of the US have the highest average complexity, while traded industries are more complex than local-serving ones on average, but with some exceptions. On average, regions with higher complexity have a higher income per capita, but those regions also were more affected by the financial crisis. Finally, economic complexity is a significant predictor of within-decreases in income per capita and population. Our findings highlight the importance of subnational regions, and particularly metropolitan areas, as units of economic geography.
AI Key Findings
Get AI-generated insights about this paper's methodology, results, significance, and more — seven facets brought into focus.
Impact
Paper Details
Authors
PDF Preview
Key Terms
Citation Network
Current paper (gray), citations (green), references (blue)
Display is limited for performance on very large graphs.
Discussion 0