Summary
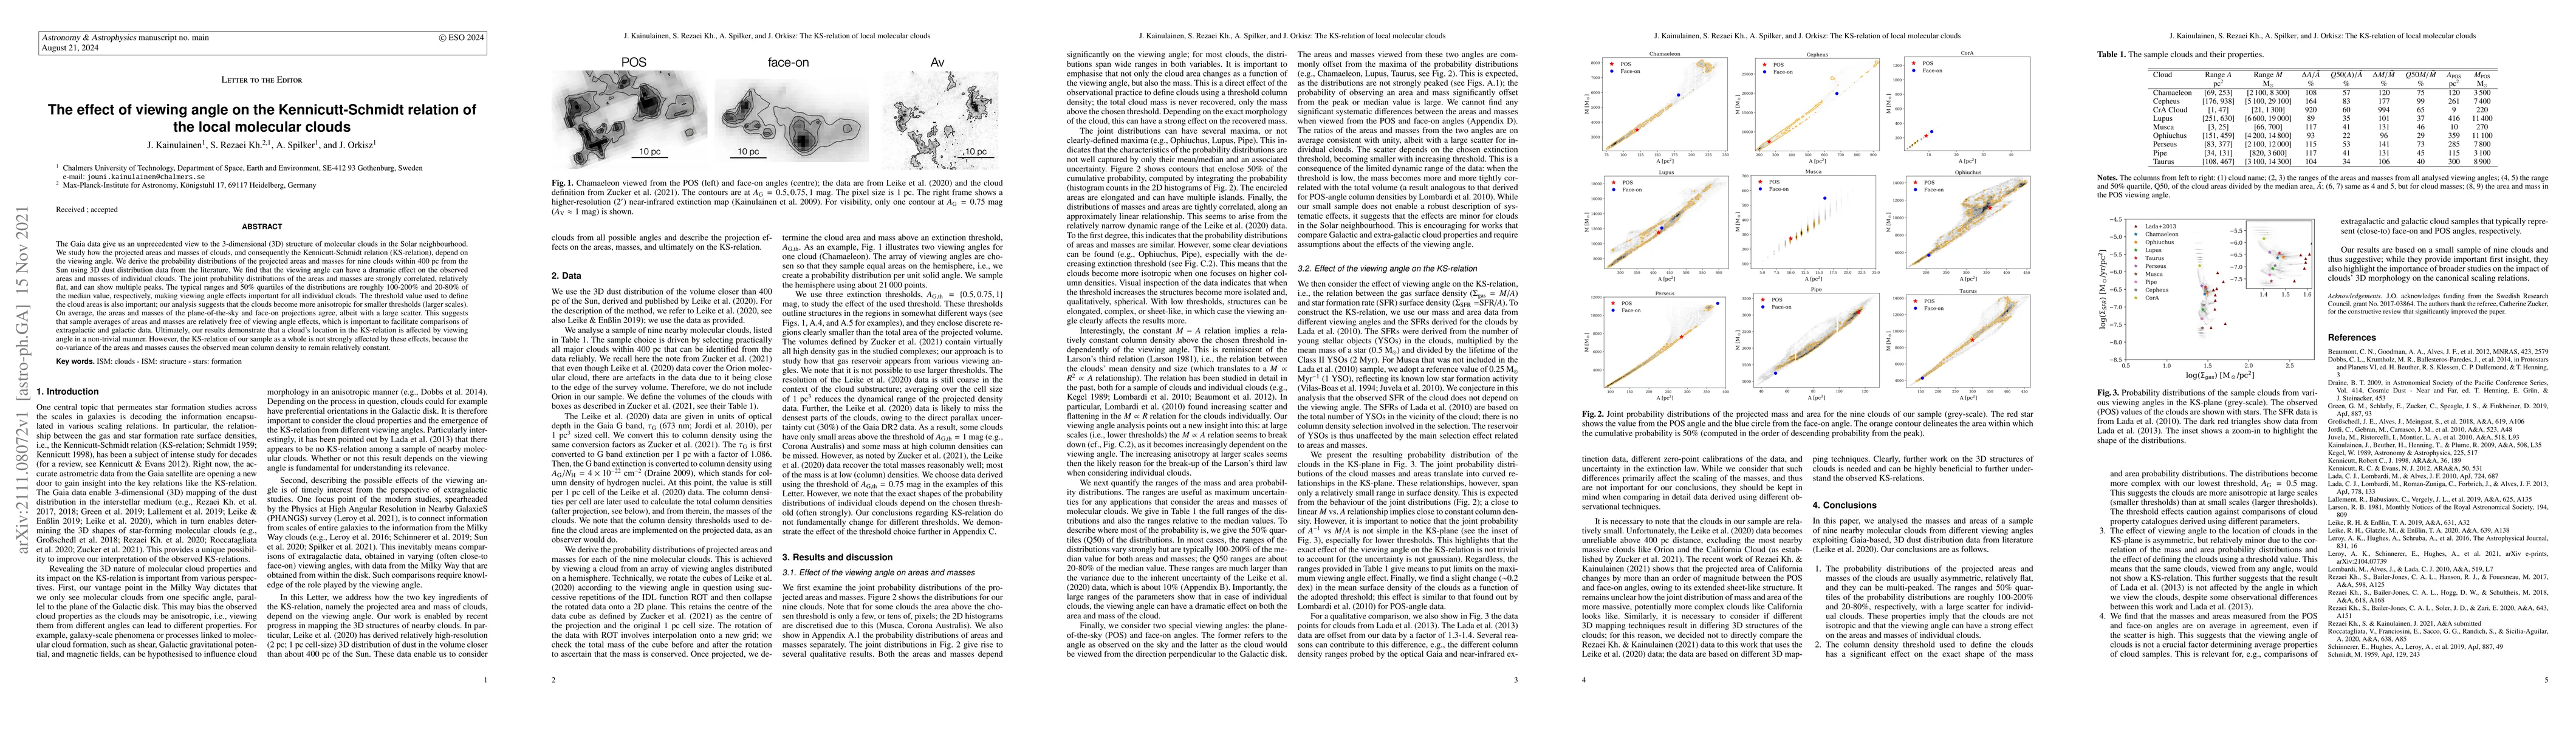
The Gaia data give us an unprecedented view to the 3-dimensional (3D) structure of molecular clouds in the Solar neighbourhood. We study how the projected areas and masses of clouds, and consequently the Kennicutt-Schmidt relation (KS-relation), depend on the viewing angle. We derive the probability distributions of the projected areas and masses for nine clouds within 400 pc from the Sun using 3D dust distribution data from the literature. We find that the viewing angle can have a dramatic effect on the observed areas and masses of individual clouds. The joint probability distributions of the areas and masses are strongly correlated, relatively flat, and can show multiple peaks. The typical ranges and 50% quartiles of the distributions are roughly 100-200% and 20-80% of the median value, respectively, making viewing angle effects important for all individual clouds. The threshold value used to define the cloud areas is also important; our analysis suggests that the clouds become more anisotropic for smaller thresholds (larger scales). On average, the areas and masses of the plane-of-the-sky and face-on projections agree, albeit with a large scatter. This suggests that sample averages of areas and masses are relatively free of viewing angle effects, which is important to facilitate comparisons of extragalactic and galactic data. Ultimately, our results demonstrate that a cloud's location in the KS-relation is affected by viewing angle in a non-trivial manner. However, the KS-relation of our sample as a whole is not strongly affected by these effects, because the co-variance of the areas and masses causes the observed mean column density to remain relatively constant.
AI Key Findings
Get AI-generated insights about this paper's methodology, results, and significance.
Paper Details
PDF Preview
Key Terms
Citation Network
Current paper (gray), citations (green), references (blue)
Display is limited for performance on very large graphs.
Similar Papers
Found 4 papers| Title | Authors | Year | Actions |
|---|
Comments (0)