01
MethodologyHow they did it
Brief description of the research methodology used
The eROSITA DR1 variability catalogue identifies 1307 X-ray sources exhibiting variability through multiple tests, including the detection of notable objects like GRB 200120A and GX 339-4, and highlights the utility of the softest eROSITA band for monitoring outbursts. Magnetically active stars and AGNs show significant variability patterns.
The eROSITA DR1 variability catalogue identifies 1307 X-ray sources exhibiting variability through multiple tests, including the detection of notable objects like GRB 200120A and GX 339-4, and highlights the utility of the softest eROSITA band for monitoring outbursts. Magnetically active stars and AGNs show significant variability patterns.
Brief description of the research methodology used More in Methodology →
Main finding 1 — Main finding 2 More in Key Results →
Why this research is important and its potential impact More in Significance →
Limitation 1 — Limitation 2 More in Limitations →
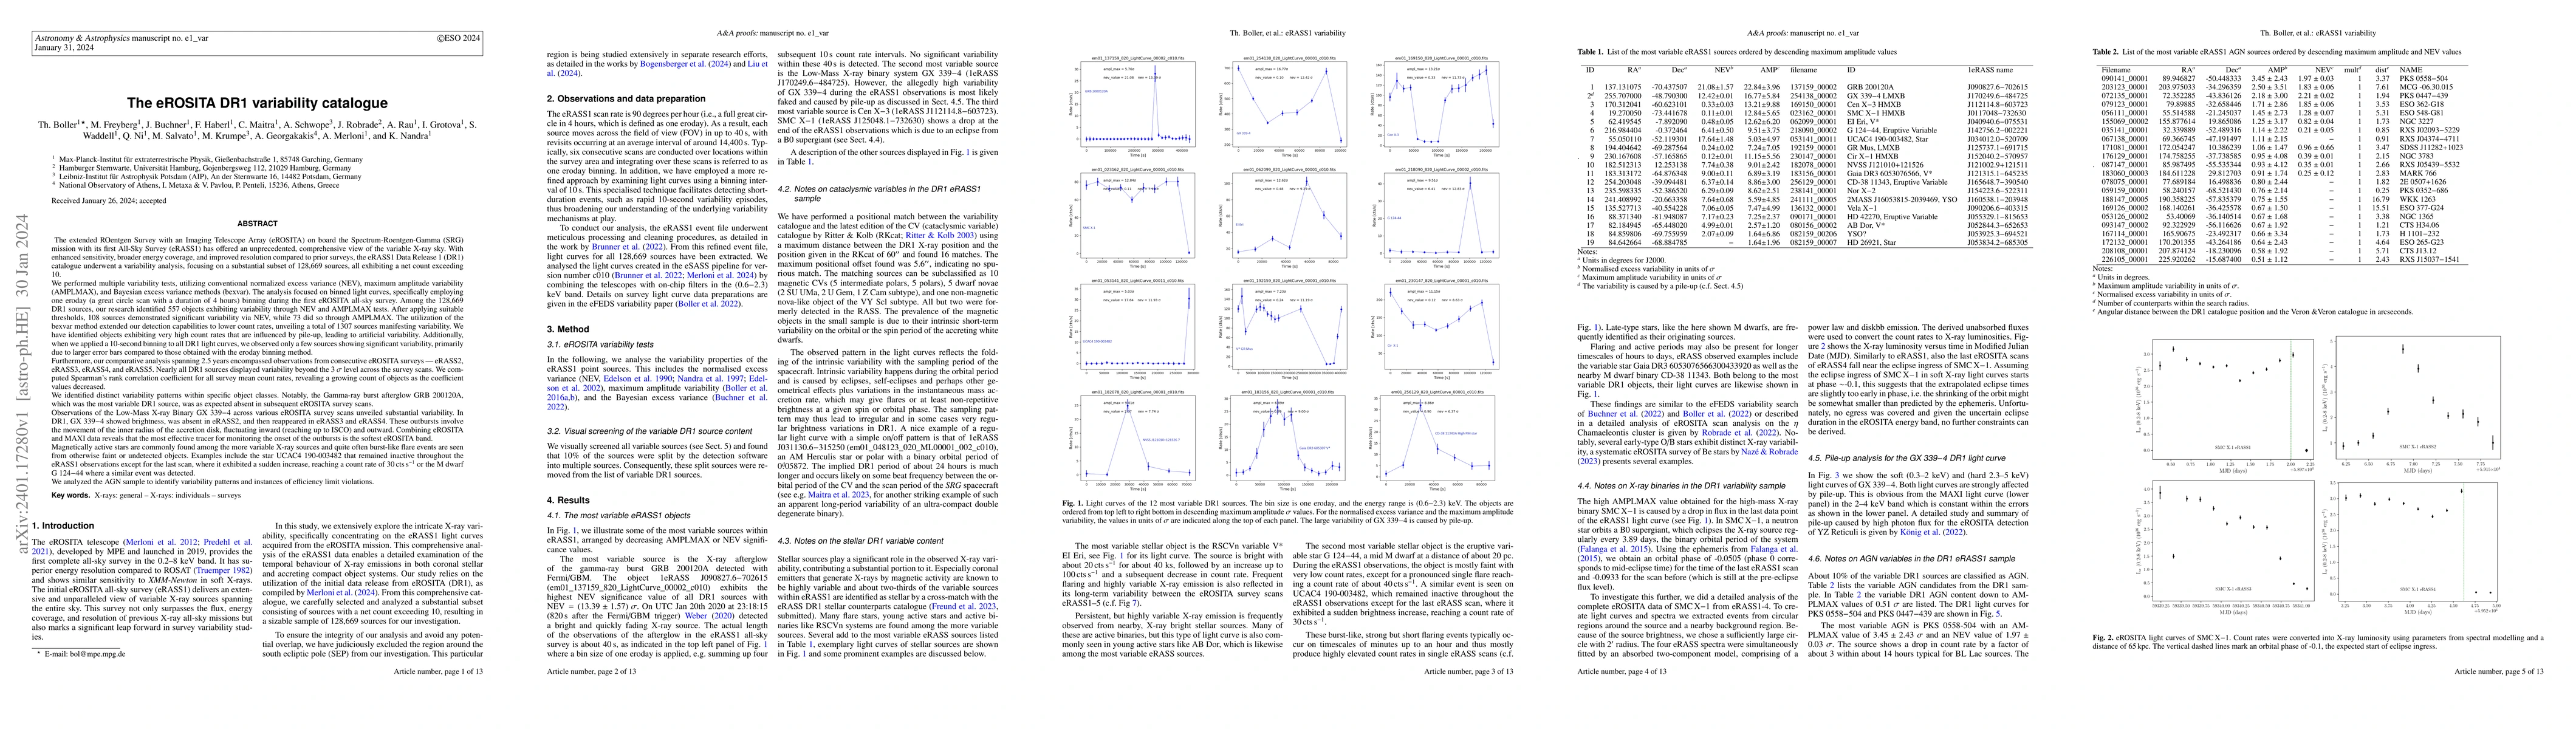
The extended ROentgen Survey with an Imaging Telescope Array (eROSITA) on board the Spectrum-Roentgen-Gamma (SRG) mission with its first All-Sky Survey (eRASS1) has offered an unprecedented, comprehensive view of the variable X-ray sky. With enhanced sensitivity, broader energy coverage, and improved resolution compared to prior surveys, the eRASS1 Data Release 1 (DR1) catalogue underwent a variability analysis, focusing on a substantial subset of 128,669 sources. We performed multiple variability tests, utilizing conventional normalized excess variance, maximum amplitude variability, and Bayesian excess variance methods. Among the 128,669 DR1 sources, our research identified 557 objects exhibiting variability through NEV and AMPLMAX tests. After applying suitable thresholds, 108 sources demonstrated significant variability via NEV, while 73 did so through AMPLMAX. The utilization of the bexvar method extended our detection capabilities to lower count rates, unveiling a total of 1307 sources manifesting variability. Furthermore, our comparative analysis spanning 2.5 years encompassed observations from consecutive eROSITA surveys, eRASS2, eRASS3, eRASS4, and eRASS5. Notably, the Gamma-ray burst afterglow GRB 200120A, which was the most variable DR1 source, was as expected absent in subsequent eROSITA survey scans. Observations of the Low-Mass X-ray Binary GX 339-4 across various eROSITA survey scans unveiled substantial variability. These outbursts involve the movement of the inner radius of the accretion disk, fluctuating inward and outward. Combining eROSITA and MAXI data reveals that the most effective tracer for monitoring the onset of the outbursts is the softest eROSITA band. Magnetically active stars are commonly found among the more variable X-ray sources. We analyzed the AGN sample to identify variability patterns and instances of efficiency limit violations.
Seven facets of this paper, analysed and brought into focus by AI.
Why this research is important and its potential impact
Brief description of the research methodology used
Why this research is important and its potential impact
Main technical or theoretical contribution
What makes this work novel or different from existing research
Current paper (gray), citations (green), references (blue)
Display is limited for performance on very large graphs.
Discussion 0