Publication
Metrics
Paper Preview
Abstract
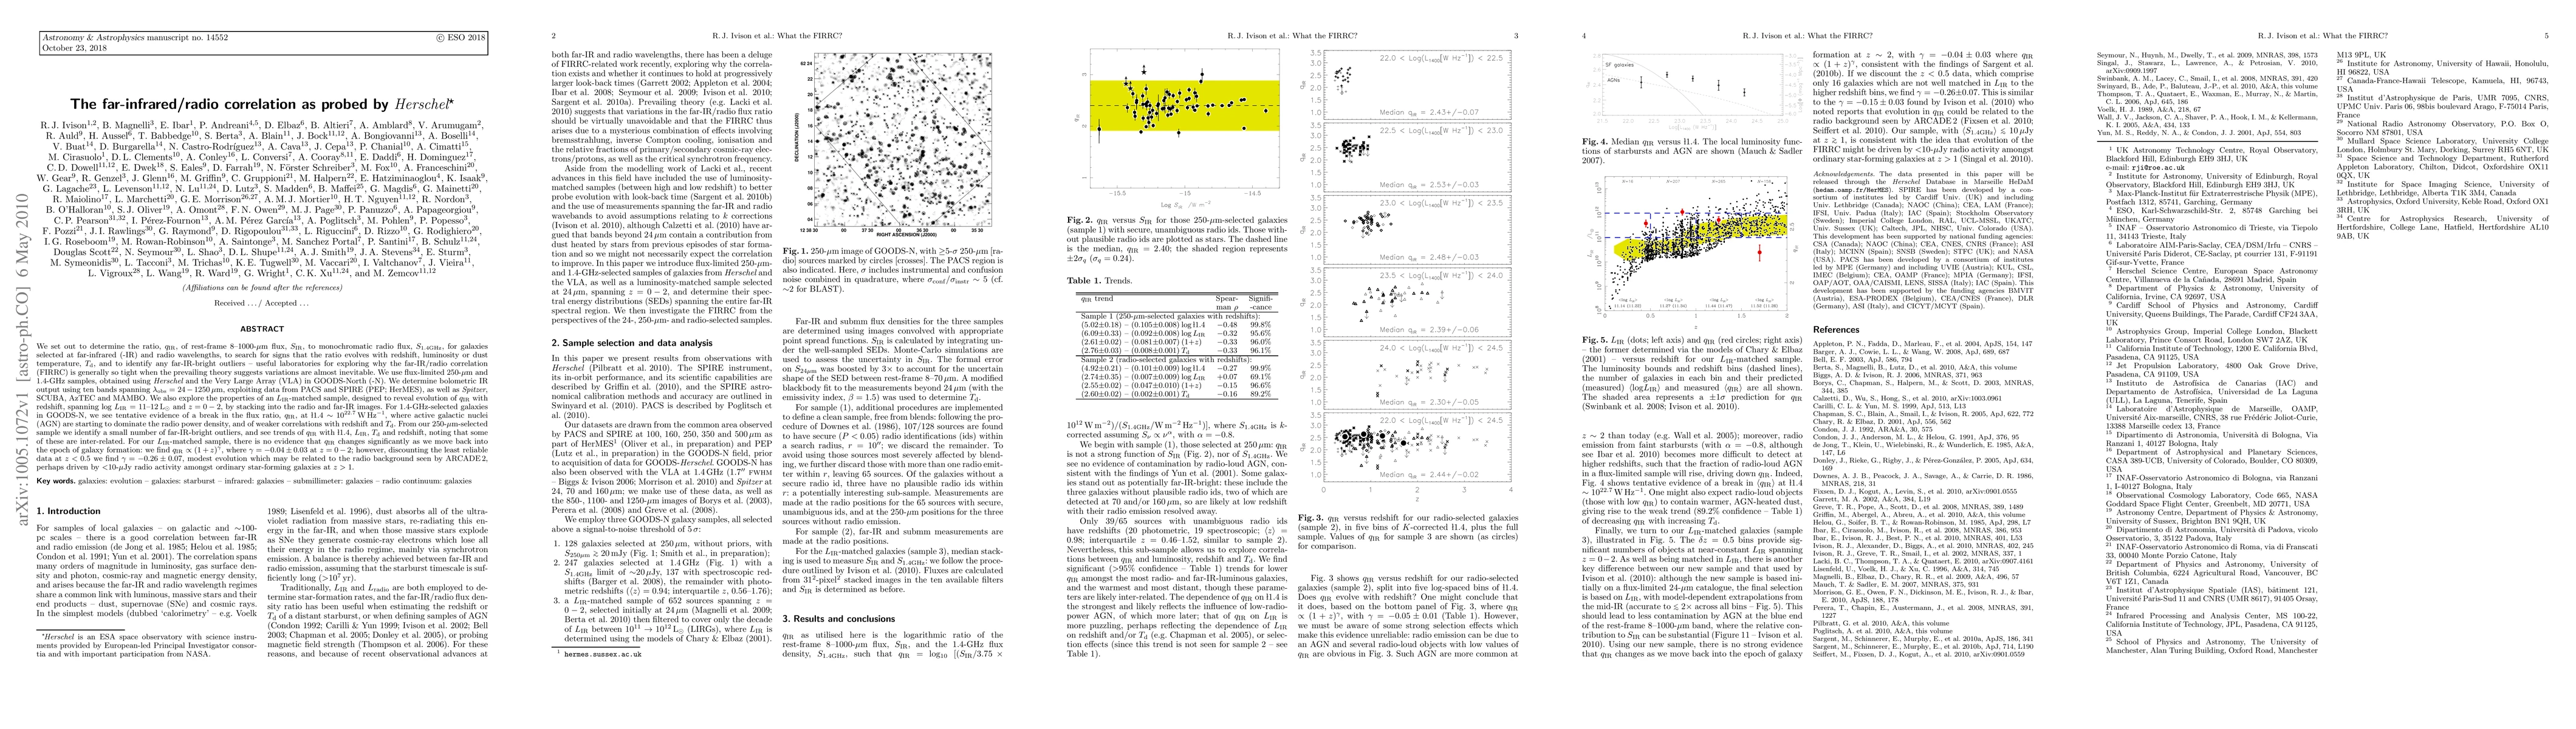
We set out to determine the ratio, q(IR), of rest-frame 8-1000um flux, S(IR), to monochromatic radio flux, S(1.4GHz), for galaxies selected at far-IR and radio wavelengths, to search for signs that the ratio evolves with redshift, luminosity or dust temperature, and to identify any far-IR-bright outliers - useful laboratories for exploring why the far-IR/radio correlation is generally so tight when the prevailing theory suggests variations are almost inevitable. We use flux-limited 250-um and 1.4-GHz samples, obtained in GOODS-N using Herschel (HerMES; PEP) and the VLA. We determine bolometric IR output using ten bands spanning 24-1250um, exploiting data from PACS and SPIRE, as well as Spitzer, SCUBA, AzTEC and MAMBO. We also explore the properties of an L(IR)-matched sample, designed to reveal evolution of q(IR) with z, spanning log L(IR) = 11-12 L(sun) and z=0-2, by stacking into the radio and far-IR images. For 1.4-GHz-selected galaxies, we see tentative evidence of a break in the flux ratio, q(IR), at L(1.4GHz) ~ 10^22.7 W/Hz, where AGN are starting to dominate the radio power density, and of weaker correlations with z and T(d). From our 250-um-selected sample we identify a small number of far-IR-bright outliers, and see trends of q(IR) with L(1.4GHz), L(IR), T(d) and z, noting that some of these are inter-related. For our L(IR)-matched sample, there is no evidence that q(IR) changes significantly as we move back into the epoch of galaxy formation: we find q(IR) goes as (1+z)^gamma, where gamma = -0.04 +/- 0.03 at z=0-2; however, discounting the least reliable data at z<0.5 we find gamma = -0.26 +/- 0.07, modest evolution which may be related to the radio background seen by ARCADE2, perhaps driven by <10uJy radio activity amongst ordinary star-forming galaxies at z>1.
AI Key Findings
Get AI-generated insights about this paper's methodology, results, significance, and more — seven facets brought into focus.
Impact
Paper Details
PDF Preview
Key Terms
Citation Network
Current paper (gray), citations (green), references (blue)
Display is limited for performance on very large graphs.
Discussion 0