Publication
Metrics
AI Quick Summary
This paper presents the first large-scale 3D map of interstellar dust temperature, derived from existing 3D reddening maps and observations by Planck and IRAS. The methodology accurately distinguishes temperature variations in different dust cloud components, which is crucial for foreground analysis in cosmic microwave background experiments.
Paper Preview
Abstract
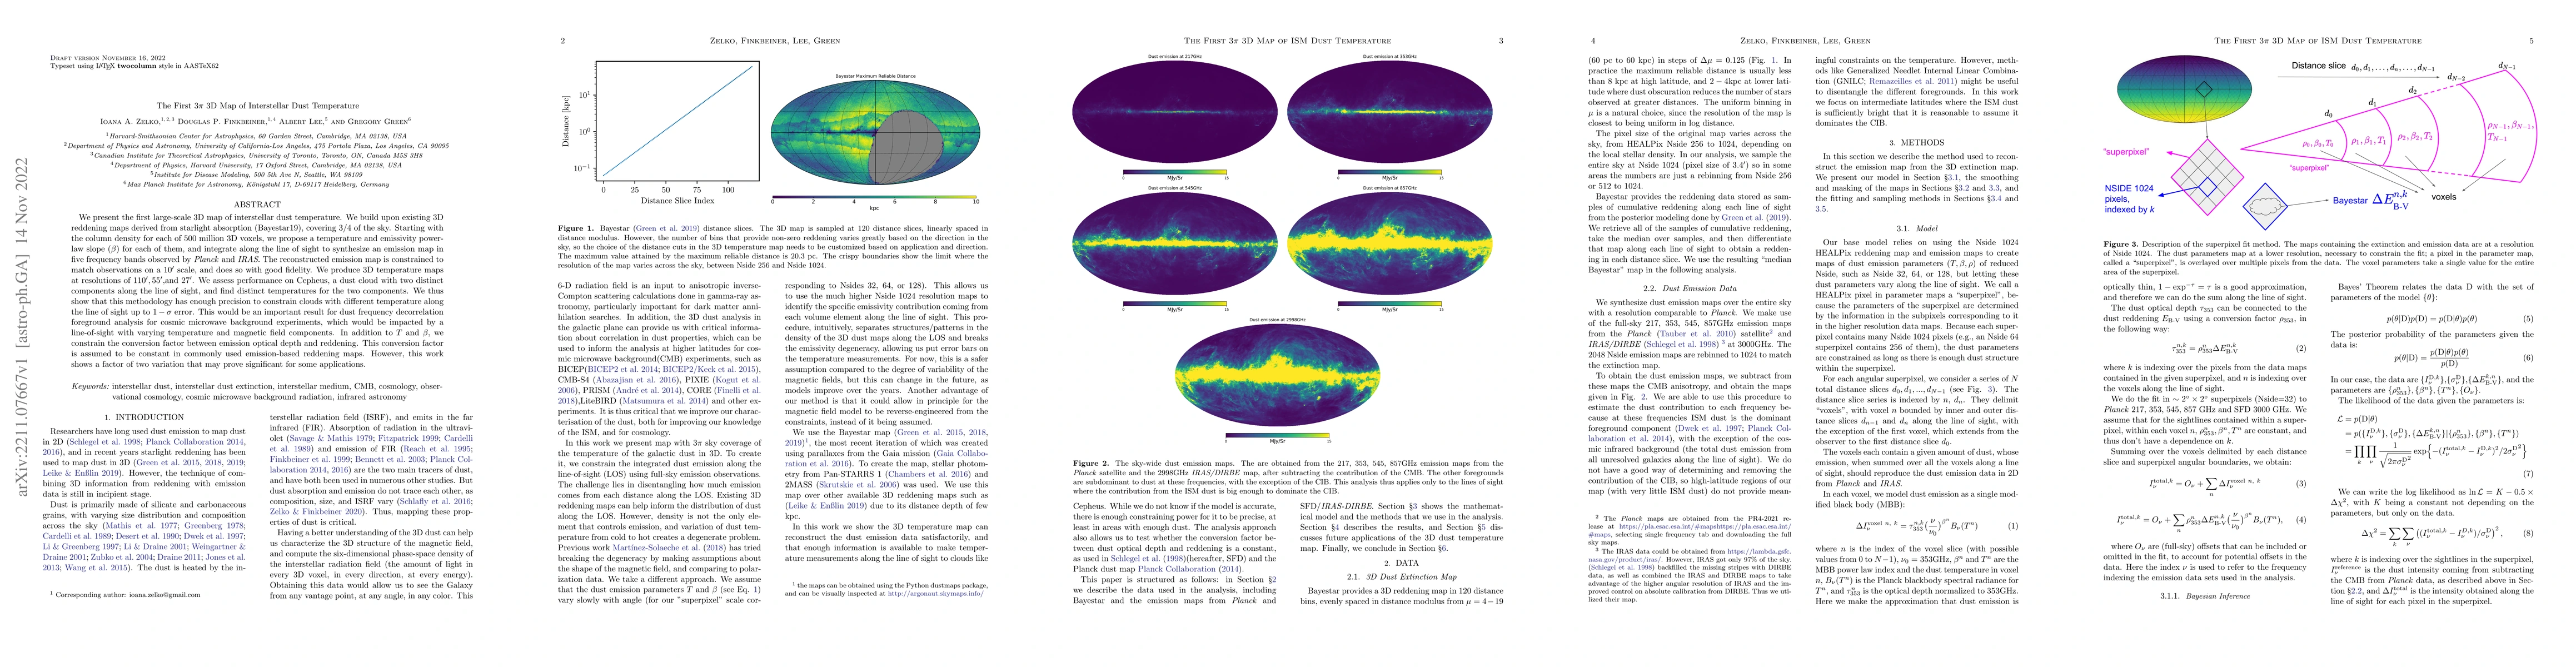
We present the first large-scale 3D map of interstellar dust temperature. We build upon existing 3D reddening maps derived from starlight absorption (Bayestar19), covering 3/4 of the sky. Starting with the column density for each of 500 million 3D voxels, we propose a temperature and emissivity power-law slope ($\beta$) for each of them, and integrate along the line of sight to synthesize an emission map in five frequency bands observed by \emph{Planck} and \emph{IRAS}. The reconstructed emission map is constrained to match observations on a $10'$ scale, and does so with good fidelity. We produce 3D temperature maps at resolutions of $110', 55', $and $27'$. We assess performance on Cepheus, a dust cloud with two distinct components along the line of sight, and find distinct temperatures for the two components. We thus show that this methodology has enough precision to constrain clouds with different temperature along the line of sight up to $1-\sigma$ error. This would be an important result for dust frequency decorrelation foreground analysis for cosmic microwave background experiments, which would be impacted by a line-of-sight with varying temperature and magnetic field components. In addition to $T$ and $\beta$, we constrain the conversion factor between emission optical depth and reddening. This conversion factor is assumed to be constant in commonly used emission-based reddening maps. However, this work shows a factor of two variation that may prove significant for some applications.
AI Key Findings
Get AI-generated insights about this paper's methodology, results, significance, and more — seven facets brought into focus.
Impact
Paper Details
Authors
PDF Preview
Key Terms
Citation Network
Current paper (gray), citations (green), references (blue)
Display is limited for performance on very large graphs.
Discussion 0