Publication
Metrics
AI Quick Summary
This paper analyzes the density and symmetry of X-ray emitting gas in the outskirts of 31 galaxy clusters, finding a steepening of density profiles beyond r500. It reveals significant deviations from spherical symmetry beyond r500 and identifies differences in gas distribution between cool-core and non-cool core clusters.
Paper Preview
Abstract
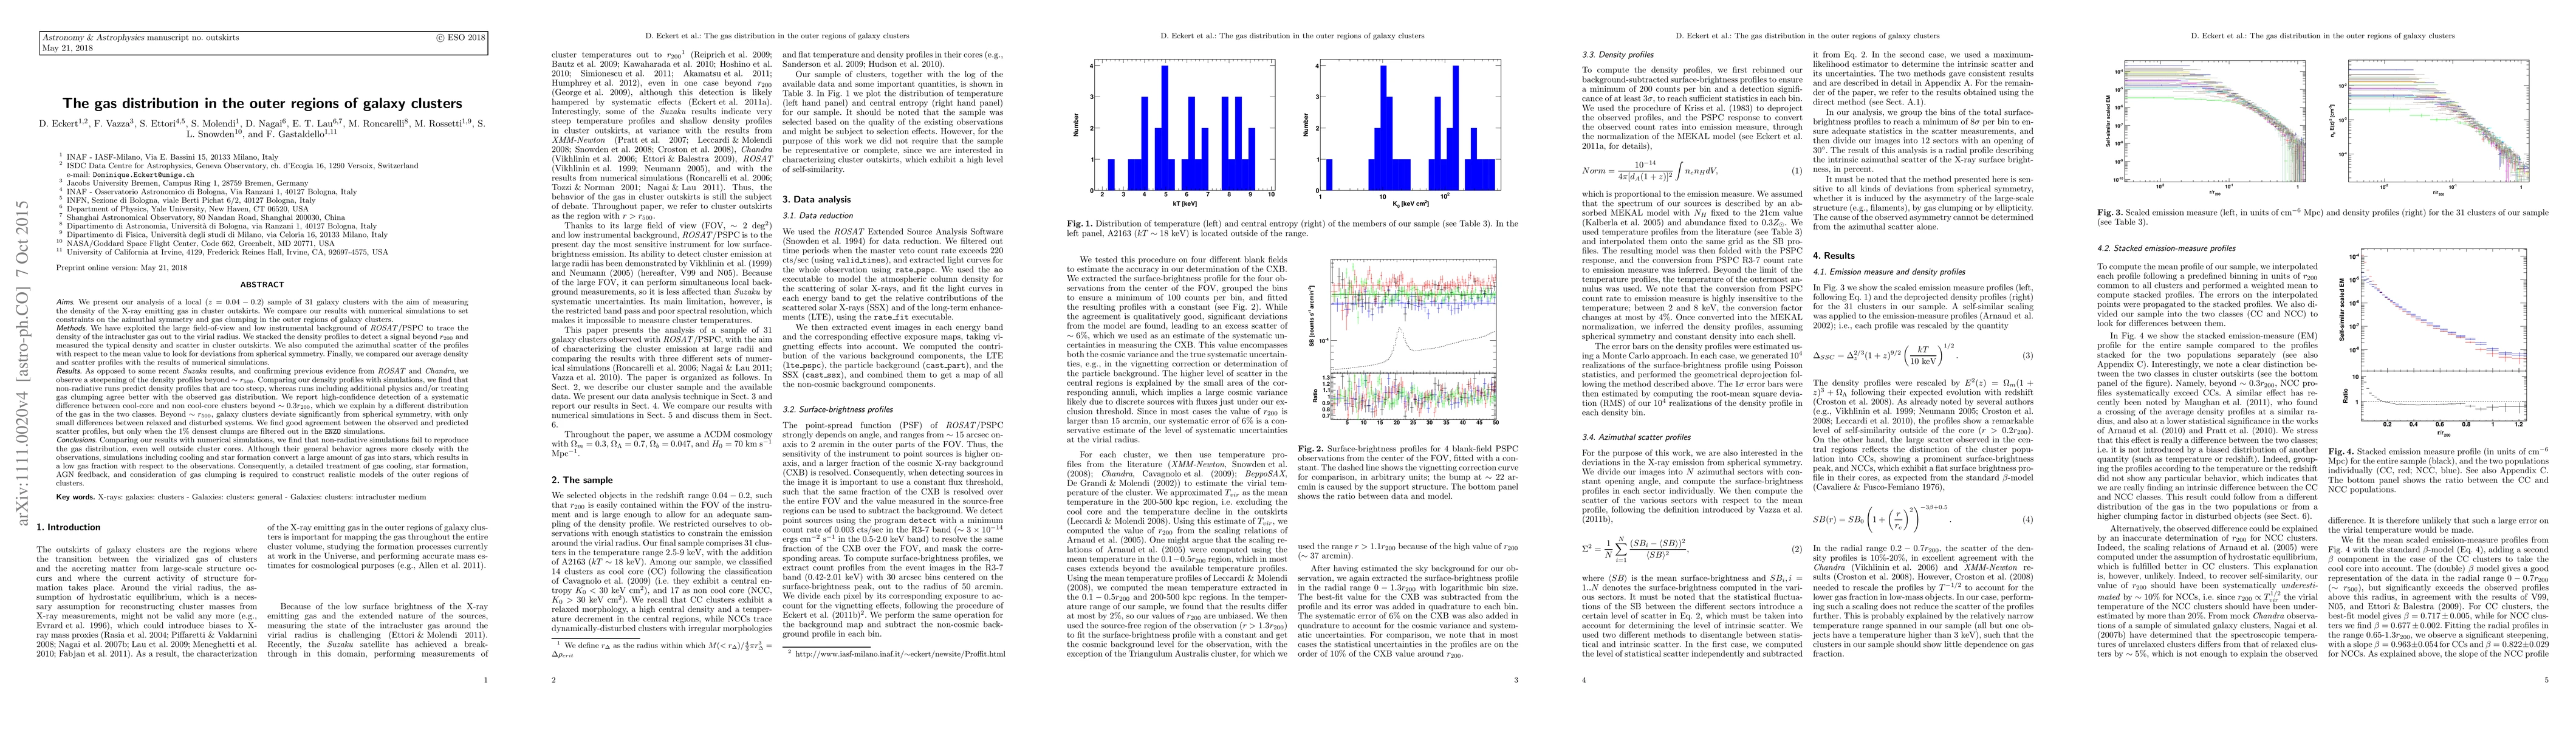
We present the analysis of a local (z = 0.04 - 0.2) sample of 31 galaxy clusters with the aim of measuring the density of the X-ray emitting gas in cluster outskirts. We compare our results with numerical simulations to set constraints on the azimuthal symmetry and gas clumping in the outer regions of galaxy clusters. We exploit the large field-of-view and low instrumental background of ROSAT/PSPC to trace the density of the intracluster gas out to the virial radius. We perform a stacking of the density profiles to detect a signal beyond r200 and measure the typical density and scatter in cluster outskirts. We also compute the azimuthal scatter of the profiles with respect to the mean value to look for deviations from spherical symmetry. Finally, we compare our average density and scatter profiles with the results of numerical simulations. As opposed to some recent Suzaku results, and confirming previous evidence from ROSAT and Chandra, we observe a steepening of the density profiles beyond \sim r500. Comparing our density profiles with simulations, we find that non-radiative runs predict too steep density profiles, whereas runs including additional physics and/or treating gas clumping are in better agreement with the observed gas distribution. We report for the first time the high-confidence detection of a systematic difference between cool-core and non-cool core clusters beyond \sim 0.3r200, which we explain by a different distribution of the gas in the two classes. Beyond \sim r500, galaxy clusters deviate significantly from spherical symmetry, with only little differences between relaxed and disturbed systems. We find good agreement between the observed and predicted scatter profiles, but only when the 1% densest clumps are filtered out in the simulations. [Abridged]
AI Key Findings
Get AI-generated insights about this paper's methodology, results, significance, and more — seven facets brought into focus.
Impact
Paper Details
PDF Preview
Key Terms
Citation Network
Current paper (gray), citations (green), references (blue)
Display is limited for performance on very large graphs.
Discussion 0