The globular cluster NGC 6388: $XMM$-Newton and $Chandra$ observations
Publication
Metrics
AI Quick Summary
This paper investigates the possibility of an intermediate-mass black hole in the globular cluster NGC 6388 using $XMM$-Newton and $Chandra$ observations, revealing unresolved X-ray sources near the cluster's center that could correspond to the black hole, with an upper limit on its accretion efficiency of $3\times 10^{-9}$. Further radio observations could refine these findings.
Paper Preview
Abstract
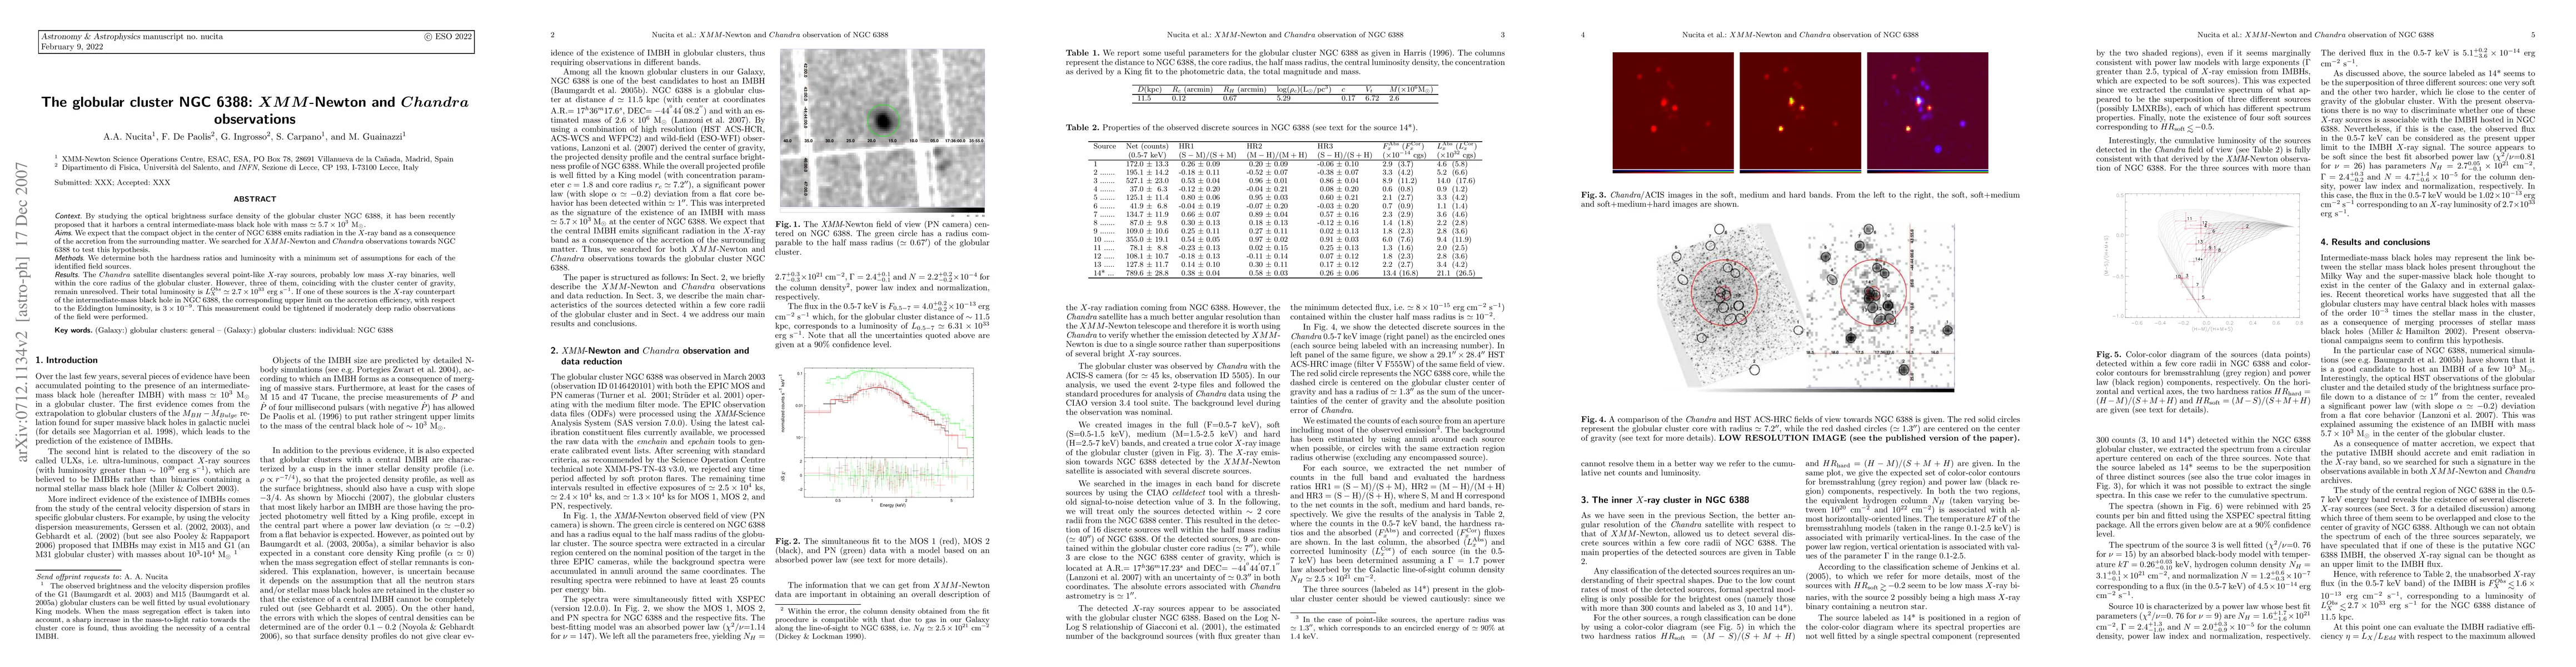
By studying the optical brightness surface density of the globular cluster NGC 6388, it has been recently proposed that it harbors a central intermediate-mass black hole with mass $\simeq 5.7\times 10^3$ M$_{\odot}$. We expect that the compact object in the center of NGC 6388 emits radiation in the $X$-ray band as a consequence of the accretion from the surrounding matter. We searched for $XMM$-Newton and $Chandra$ observations towards NGC 6388 to test this hypothesis. The $Chandra$ satellite disentangles several point-like $X$-ray sources, probably low mass $X$-ray binaries, well within the core radius of the globular cluster. However, three of them, coinciding with the cluster center of gravity, remain unresolved. Their total luminosity is $L_X^{Obs}\simeq 2.7\times 10^{33}$ erg s$^{-1}$. If one of these sources is the $X$-ray counterpart of the intermediate-mass black hole in NGC 6388, the corresponding upper limit on the accretion efficiency, with respect to the Eddington luminosity, is $3\times 10^{-9}$. This measurement could be tightened if moderately deep radio observations of the field were performed.
AI Key Findings
Get AI-generated insights about this paper's methodology, results, significance, and more — seven facets brought into focus.
Discussion 0