Publication
Metrics
AI Quick Summary
The paper utilizes complex coloring to visualize the quantum dilogarithm function $G_b(z)$, illustrating its analytic and asymptotic behaviors, and demonstrates its limiting process to the Gamma function as $b$ approaches zero. It also examines connections between $G_b(z)$ and various forms of the quantum dilogarithm.
Paper Preview
Abstract
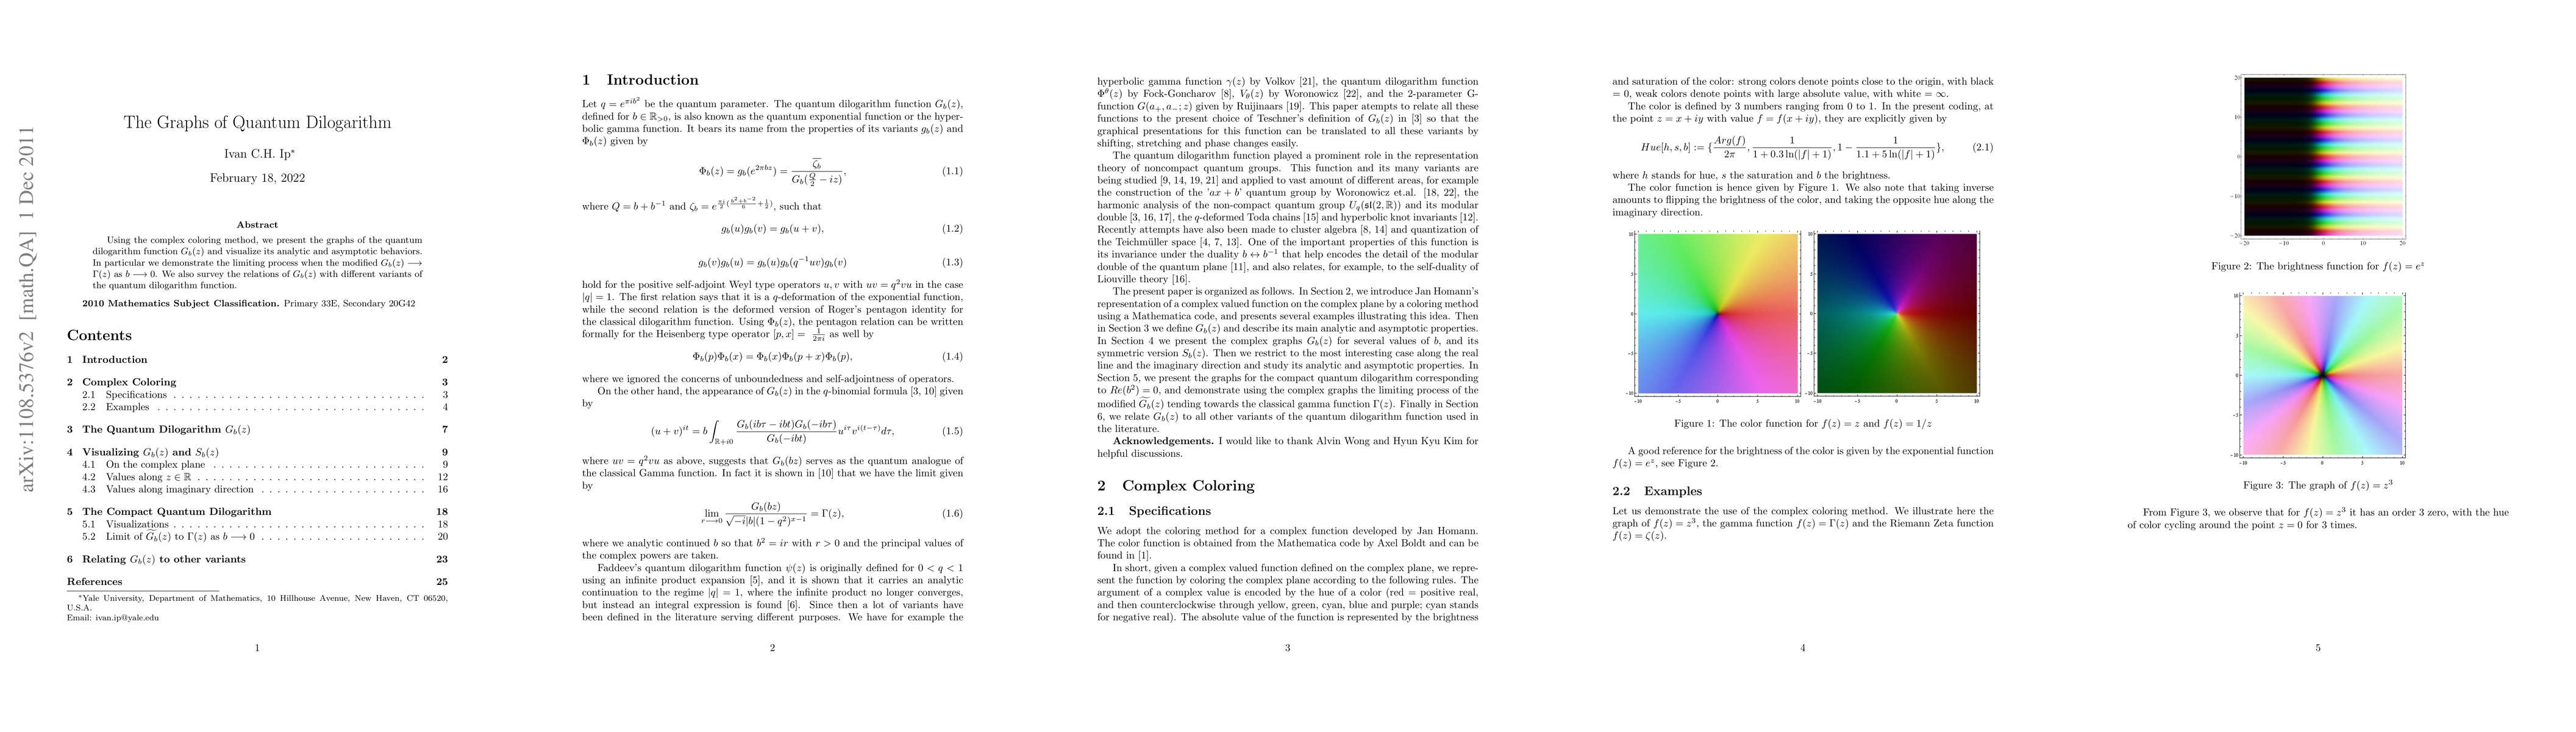
Using the complex coloring method, we present the graphs of the quantum dilogarithm function $G_b(z)$ and visualize its analytic and asymptotic behaviours. In particular we demonstrate the limiting process when the modified $G_b(z)\to \Gamma(z)$ as $b\to 0$. We also survey the relations of $G_b(z)$ with different variants of the quantum dilogarithm function.
AI Key Findings
Get AI-generated insights about this paper's methodology, results, significance, and more — seven facets brought into focus.
Impact
Paper Details
PDF Preview
Key Terms
Citation Network
Current paper (gray), citations (green), references (blue)
Display is limited for performance on very large graphs.
Discussion 0