Authors
Summary
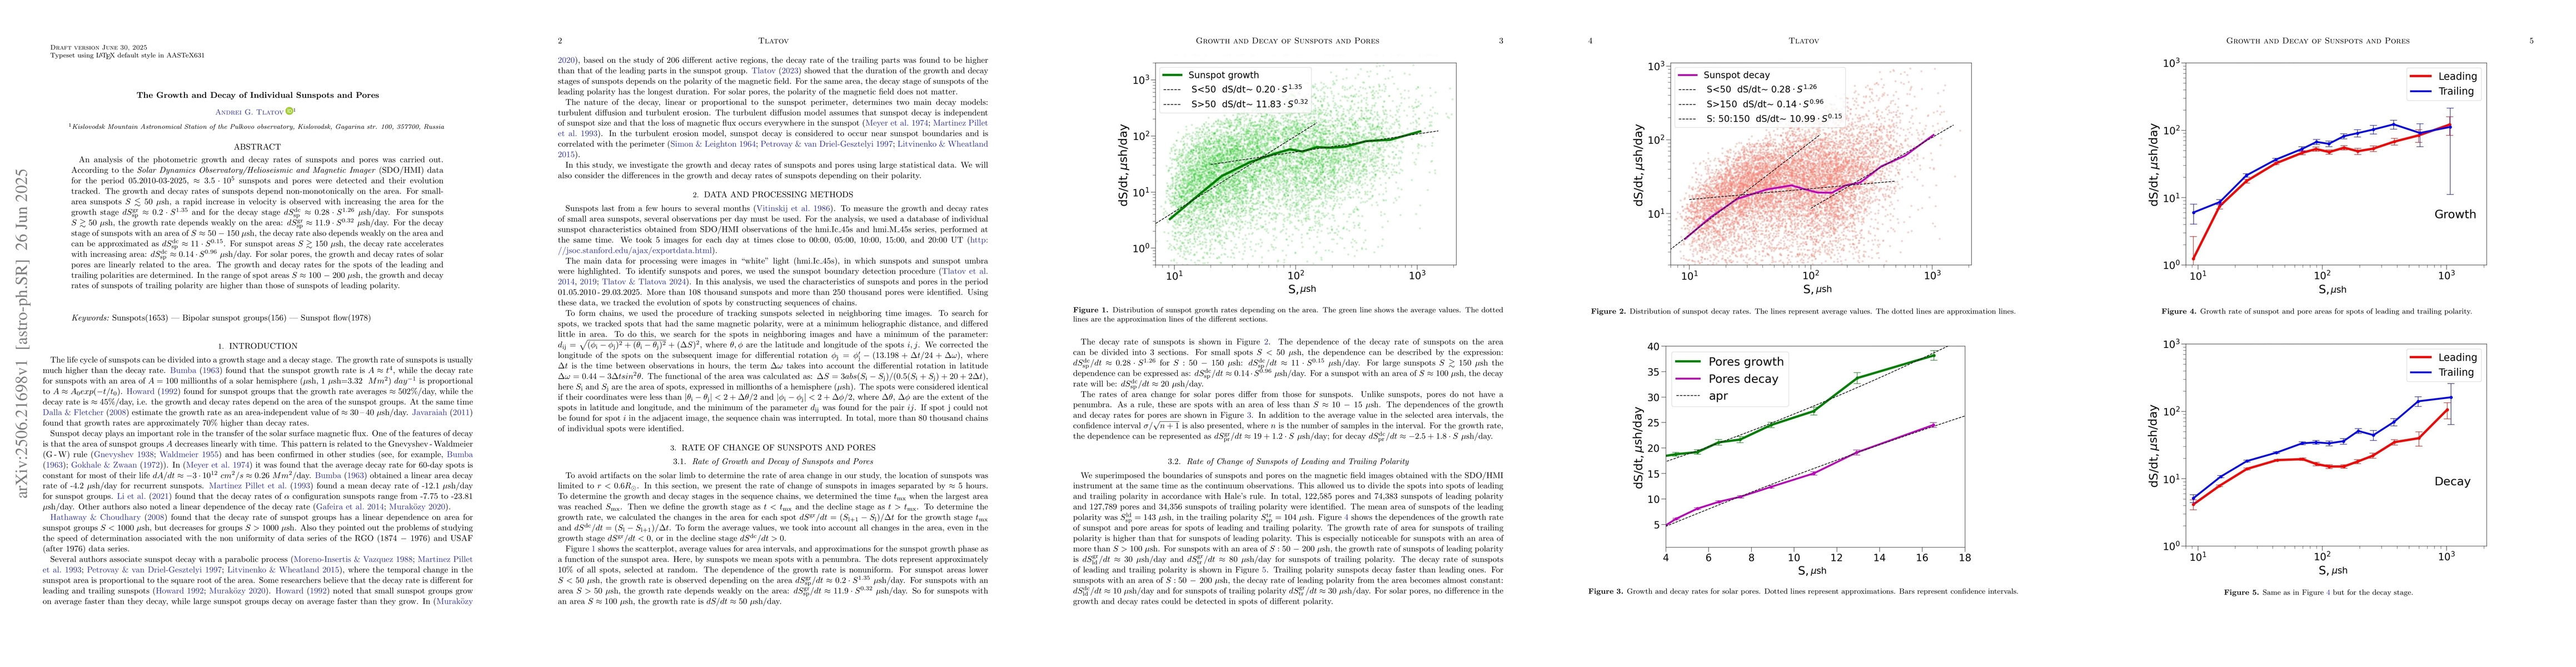
An analysis of the photometric growth and decay rates of sunspots and pores was carried out. According to the \textit{Solar Dynamics Observatory/Helioseismic and Magnetic Imager} (SDO/HMI) data for the period 05.2010-03-2025, $\approx 3.5\cdot 10^{\rm 5}$ sunspots and pores were detected and their evolution tracked. The growth and decay rates of sunspots depend non-monotonically on the area. For small-area sunspots $S \lesssim 50$ $\mu$sh, a rapid increase in velocity is observed with increasing the area for the growth stage $dS^{\rm gr}_{\rm sp}\approx 0.2 \cdot S^{\rm 1.35}$ and for the decay stage $dS^{\rm dc}_{\rm sp}\approx 0.28 \cdot S^{\rm 1.26} $ $\mu$sh/day. For sunspots $S\gtrsim 50$ $\mu$sh, the growth rate depends weakly on the area: $dS^{\rm gr}_{\rm sp}\approx 11.9 \cdot S^{\rm 0.32}$ $\mu$sh/day. For the decay stage of sunspots with an area of $S\approx 50\,-\,150$ $\mu$sh, the decay rate also depends weakly on the area and can be approximated as $dS^{\rm dc}_{\rm sp}\approx 11 \cdot S^{\rm 0.15} $. For sunspot areas $S\gtrsim 150$ $\mu$sh, the decay rate accelerates with increasing area: $dS^{\rm dc}_{\rm sp}\approx 0.14 \cdot S^{\rm 0.96} $ $\mu$sh/day. For solar pores, the growth and decay rates of solar pores are linearly related to the area. The growth and decay rates for the spots of the leading and trailing polarities are determined. In the range of spot areas $S\approx 100\,-\,200$ $\mu$sh, the growth and decay rates of sunspots of trailing polarity are higher than those of sunspots of leading polarity.
AI Key Findings
Get AI-generated insights about this paper's methodology, results, and significance.
Paper Details
PDF Preview
Citation Network
Current paper (gray), citations (green), references (blue)
Display is limited for performance on very large graphs.
Similar Papers
Found 4 papersMeridional Movements of Individual Sunspots and Pores
Andrey Tlatov, Kseniya Tlatova
Differential Rotation of Individual Sunspots and Pores
Andrei G. Tlatov, Kseniia A. Tlatova
The Decay of Two Adjacent Sunspots Associated with Moving Magnetic Features
Jincheng Wang, Yang Peng, Zhike Xue et al.
No citations found for this paper.
Comments (0)